
Which Temple Zip Codes Appreciated The Most And The Least?
A few bonus charts not included in the report released last week


Introduction
In my last report, I argued that the 'Temple Premium' is actually a 'Selection Premium'—meaning the Church builds in areas that are already set up for success. Today's charts support that theory. When you look at the raw numbers below, you aren't seeing a 'Temple Effect'; you are seeing the regional economic wave that these temples were surfing.
If you haven’t read the summary or the paper, here is a link:

Today, I thought it might be interesting to share some extra charts and analysis plotting how individual zip codes performed which might be interesting to some of you.
Of the 42 temple zip codes I analyzed, which performed the best? Which performed the worst? Which outperformed the national average?
Note: these 42 temples were announced at various points during the period of 2010-2023.
Charts
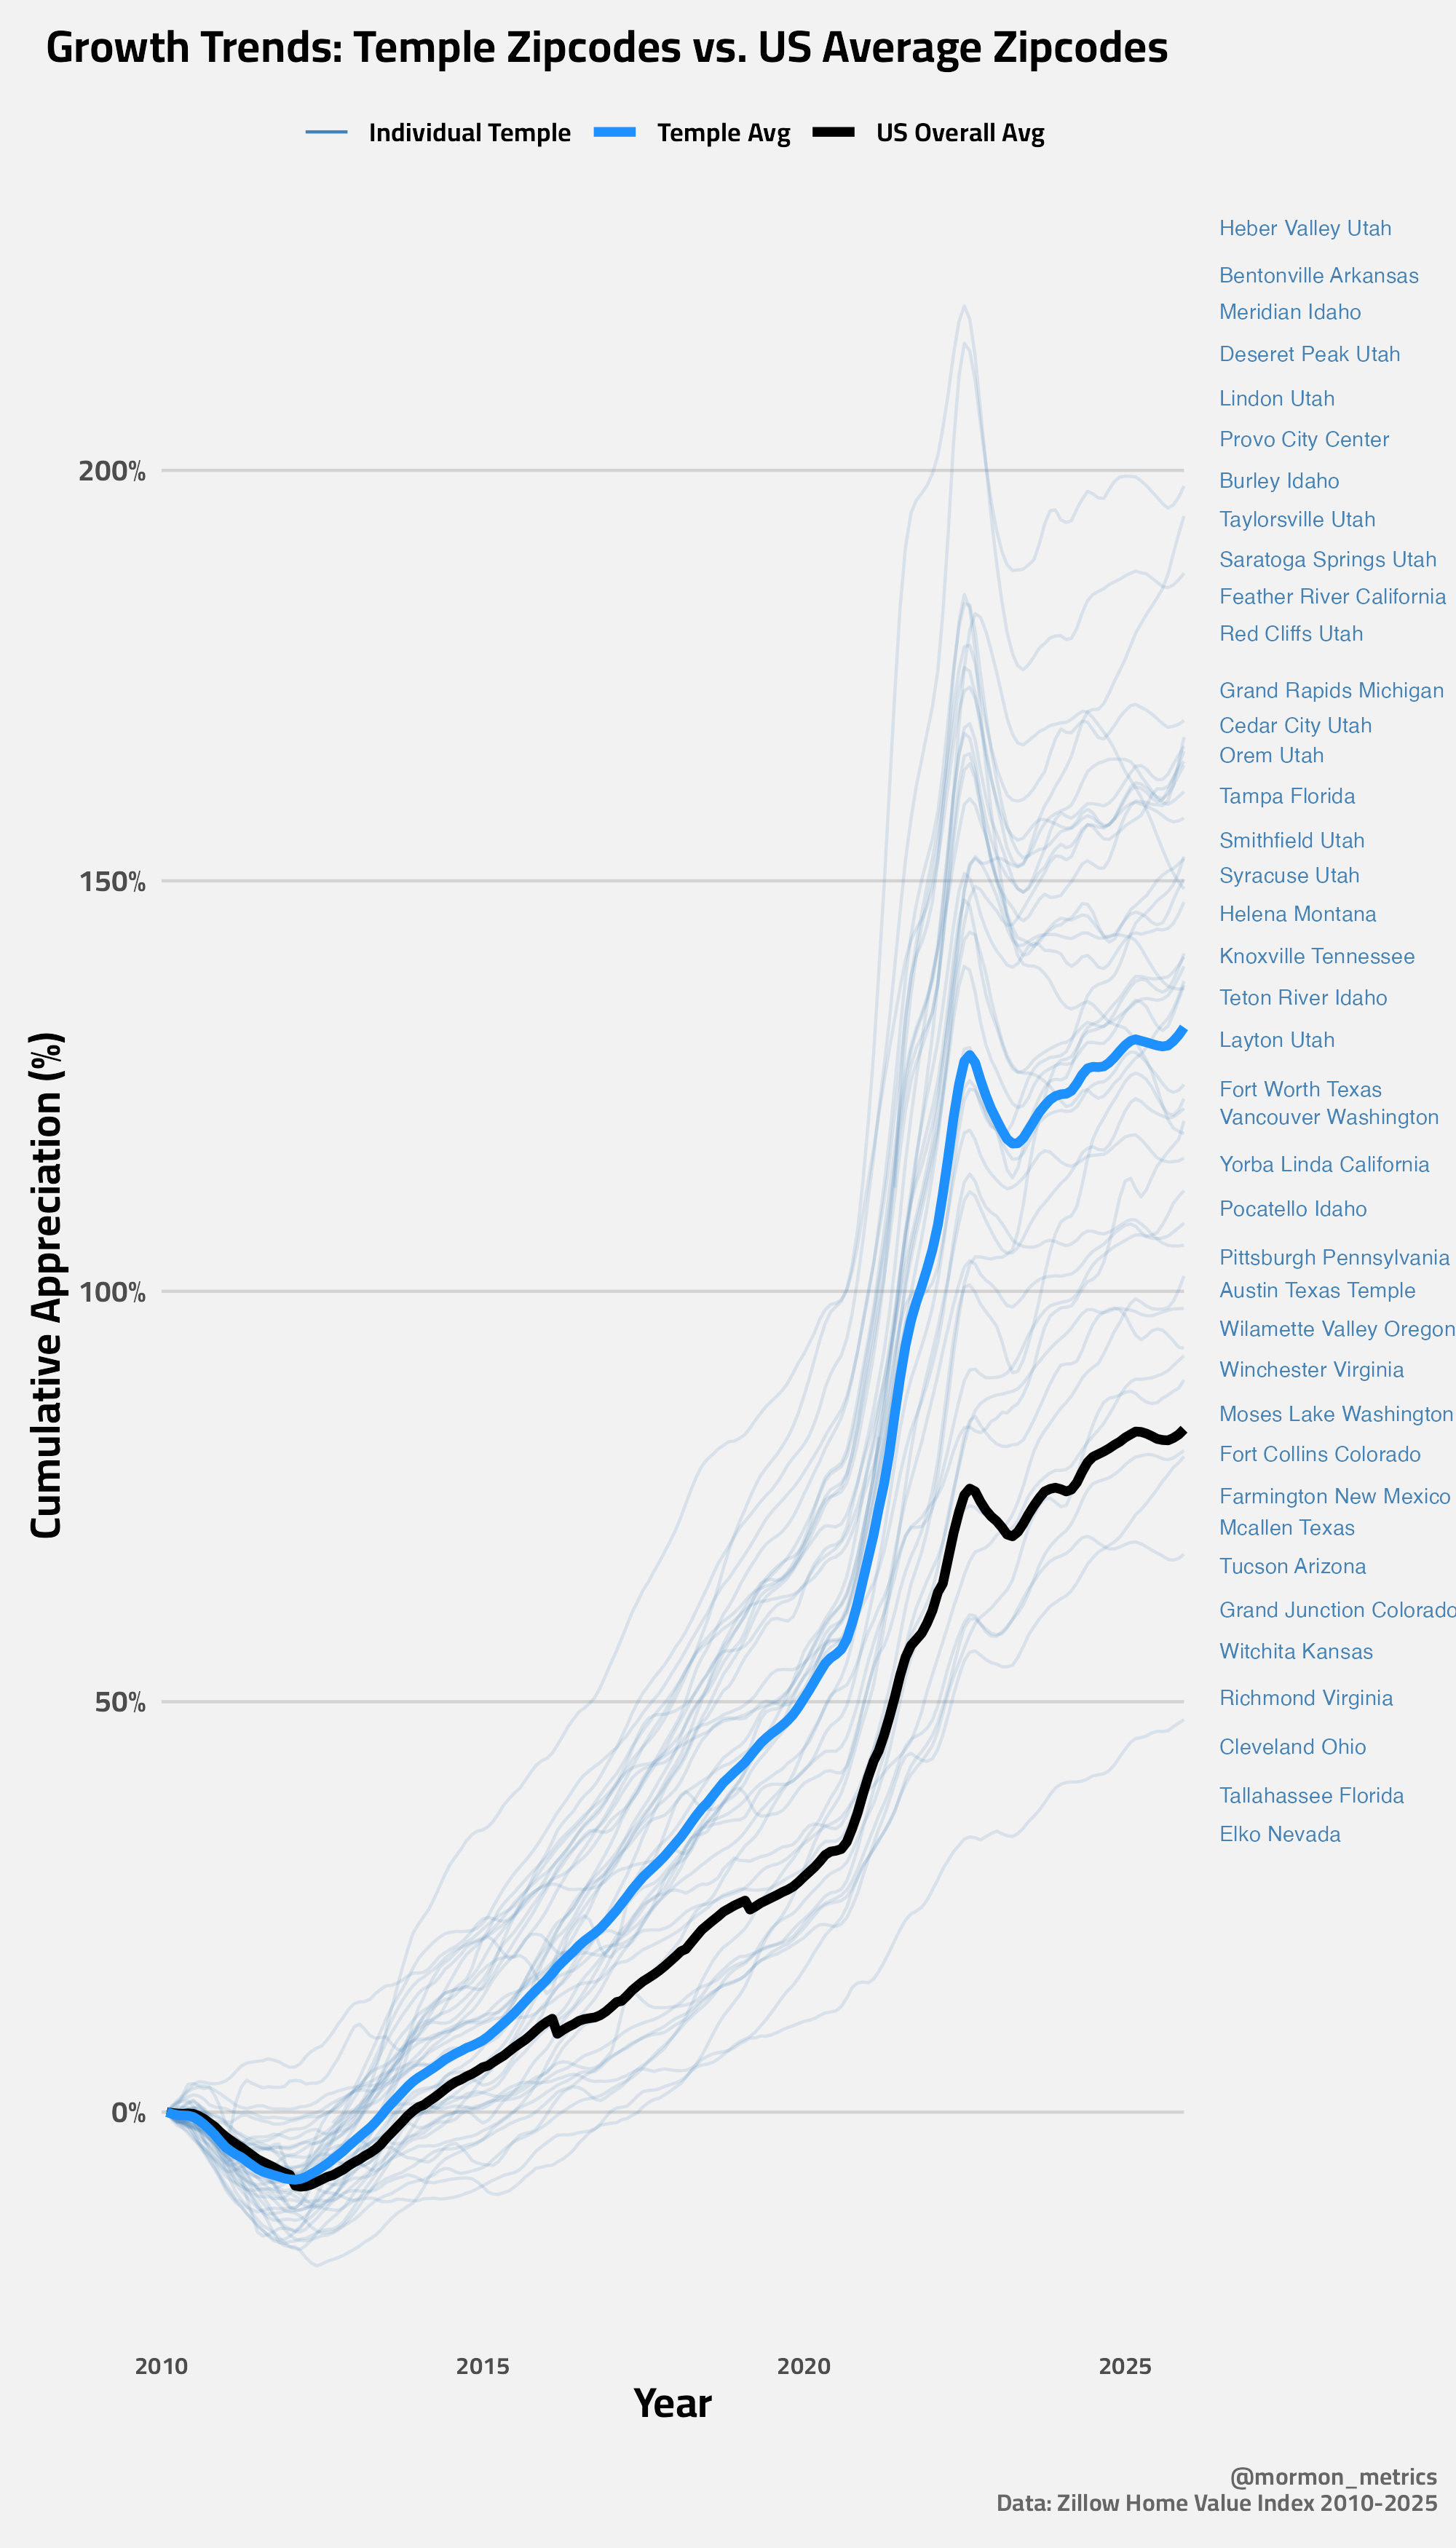
Note: To ensure the text is legible, I used an algorithm to space out the labels on the right. They generally follow the order of the lines, but some are nudged slightly to prevent overlapping.
As you can see, temple zip codes generally perform better than the average. Compare the blue 'Temple Average' line against the black 'US Overall' line—the gap is undeniable. The vast majority of temple zipcodes outperform the US average, but here are the exceptions:
Elko Nevada (89801) - 48% average house appreciation since 2010. Compare this number to the national average of 83%.
Tallahassee Florida (32309) - 68% appreciation.
Casper Wyoming (82604) - 78% appreciation (this one is missing from the chart due to a few missing data points).
Cleveland Ohio (44131) - 80% appreciation.
Richmond Virginia (23060) - 81% appreciation
The highest performers were largely concentrated in the Mountain West. Here are the top 10:
Heber Valley Utah (84032) - 198% average house in zip code appreciation since 2010. Compare this number to the national average of 83%.
Bentonville Arkansas (72712) - 194% appreciation
Meridian Idaho (83646) - 188% appreciation
Deseret Peak Utah (84074) - 170% appreciation
Lindon Utah (84042) - 168% appreciation
Provo City Center (84601) - 166% appreciation
Burley Idaho (83318) - 165% appreciation
Taylorsville Utah (84129) - 165% appreciation
Saratoga Springs Utah (84045) - 164% appreciation
Feather River California (95993) - 161% appreciation
A Natural Follow up question to these numbers is what the state appreciation look like during this time period…
Here are the top 5 cumulative appreciation states:
Idaho - 163%
Utah - 145%
Arizona - 144%
Florida 143%
Nevada 143%
And the bottom 5:
Louisiana - 15%
Illinois - 34%
Mississippi - 35%
North Dakota - 43%
New Mexico - 43%
For these numbers I averaged the zip codes at the state level which is by no means a perfect measure, but should work fine as a barometer.
“The ‘Chicken or the Egg’ in the Mountain West
You might look at these charts and say, ‘Of course they build in Utah and Idaho—that’s where the members are!’
Exactly. And that is the point.
The Church follows the members. And where are the members? They are in the highest-growth economic corridors: the Silicon Slopes in Lehi/Lindon, the tech boom in Boise/Meridian, and the lifestyle hubs of Heber Valley.
The top-performing Temple zip codes (Heber, Meridian, Lindon, Provo) are almost exclusively located in the top-performing states (Idaho and Utah). While temple zip codes do outperform the average zip code, it is largely connected to the economic success of the Mountain West over the last decade (high migration, tech sector growth, and remote work shifts).
Code for this post is available here.
Im shocked housing prices in Elko have gone up that much. Love you, Elko.