
What Factors in a Country Predict Church Growth?
Using Several Data Sources Including Facebook Immigration data, UNESCO, World Bank, Freedom House, and Others


Introduction
Skip down to the conclusion for a TLDR
I had a few people reach out to me last week concerning my previous two posts with some great questions that I want to explore today. Here are some of the questions:
How is immigration or emigration related to church growth rates? It is clearly connected in the case of say Ukraine, but what about the regular flow of people in or out of a country in a typical year?
How are birth rates related to growth? You should see which countries are over and under performing based on their birthrates.
From these questions, I decided that I was going to build a model understanding the factors that influence church growth in a country.
Charts
Which countries are people entering and exiting? Is it correlated with Church growth?
NYT did a great visualization of this data here if anyone is interested.
So, first of all, this is super interesting data. Countries keep track of who enters and exits their country legally, but what about those who don’t? Facebook doesn’t track people’s legal status, but does have their location. So we can have a fuller picture of movement.
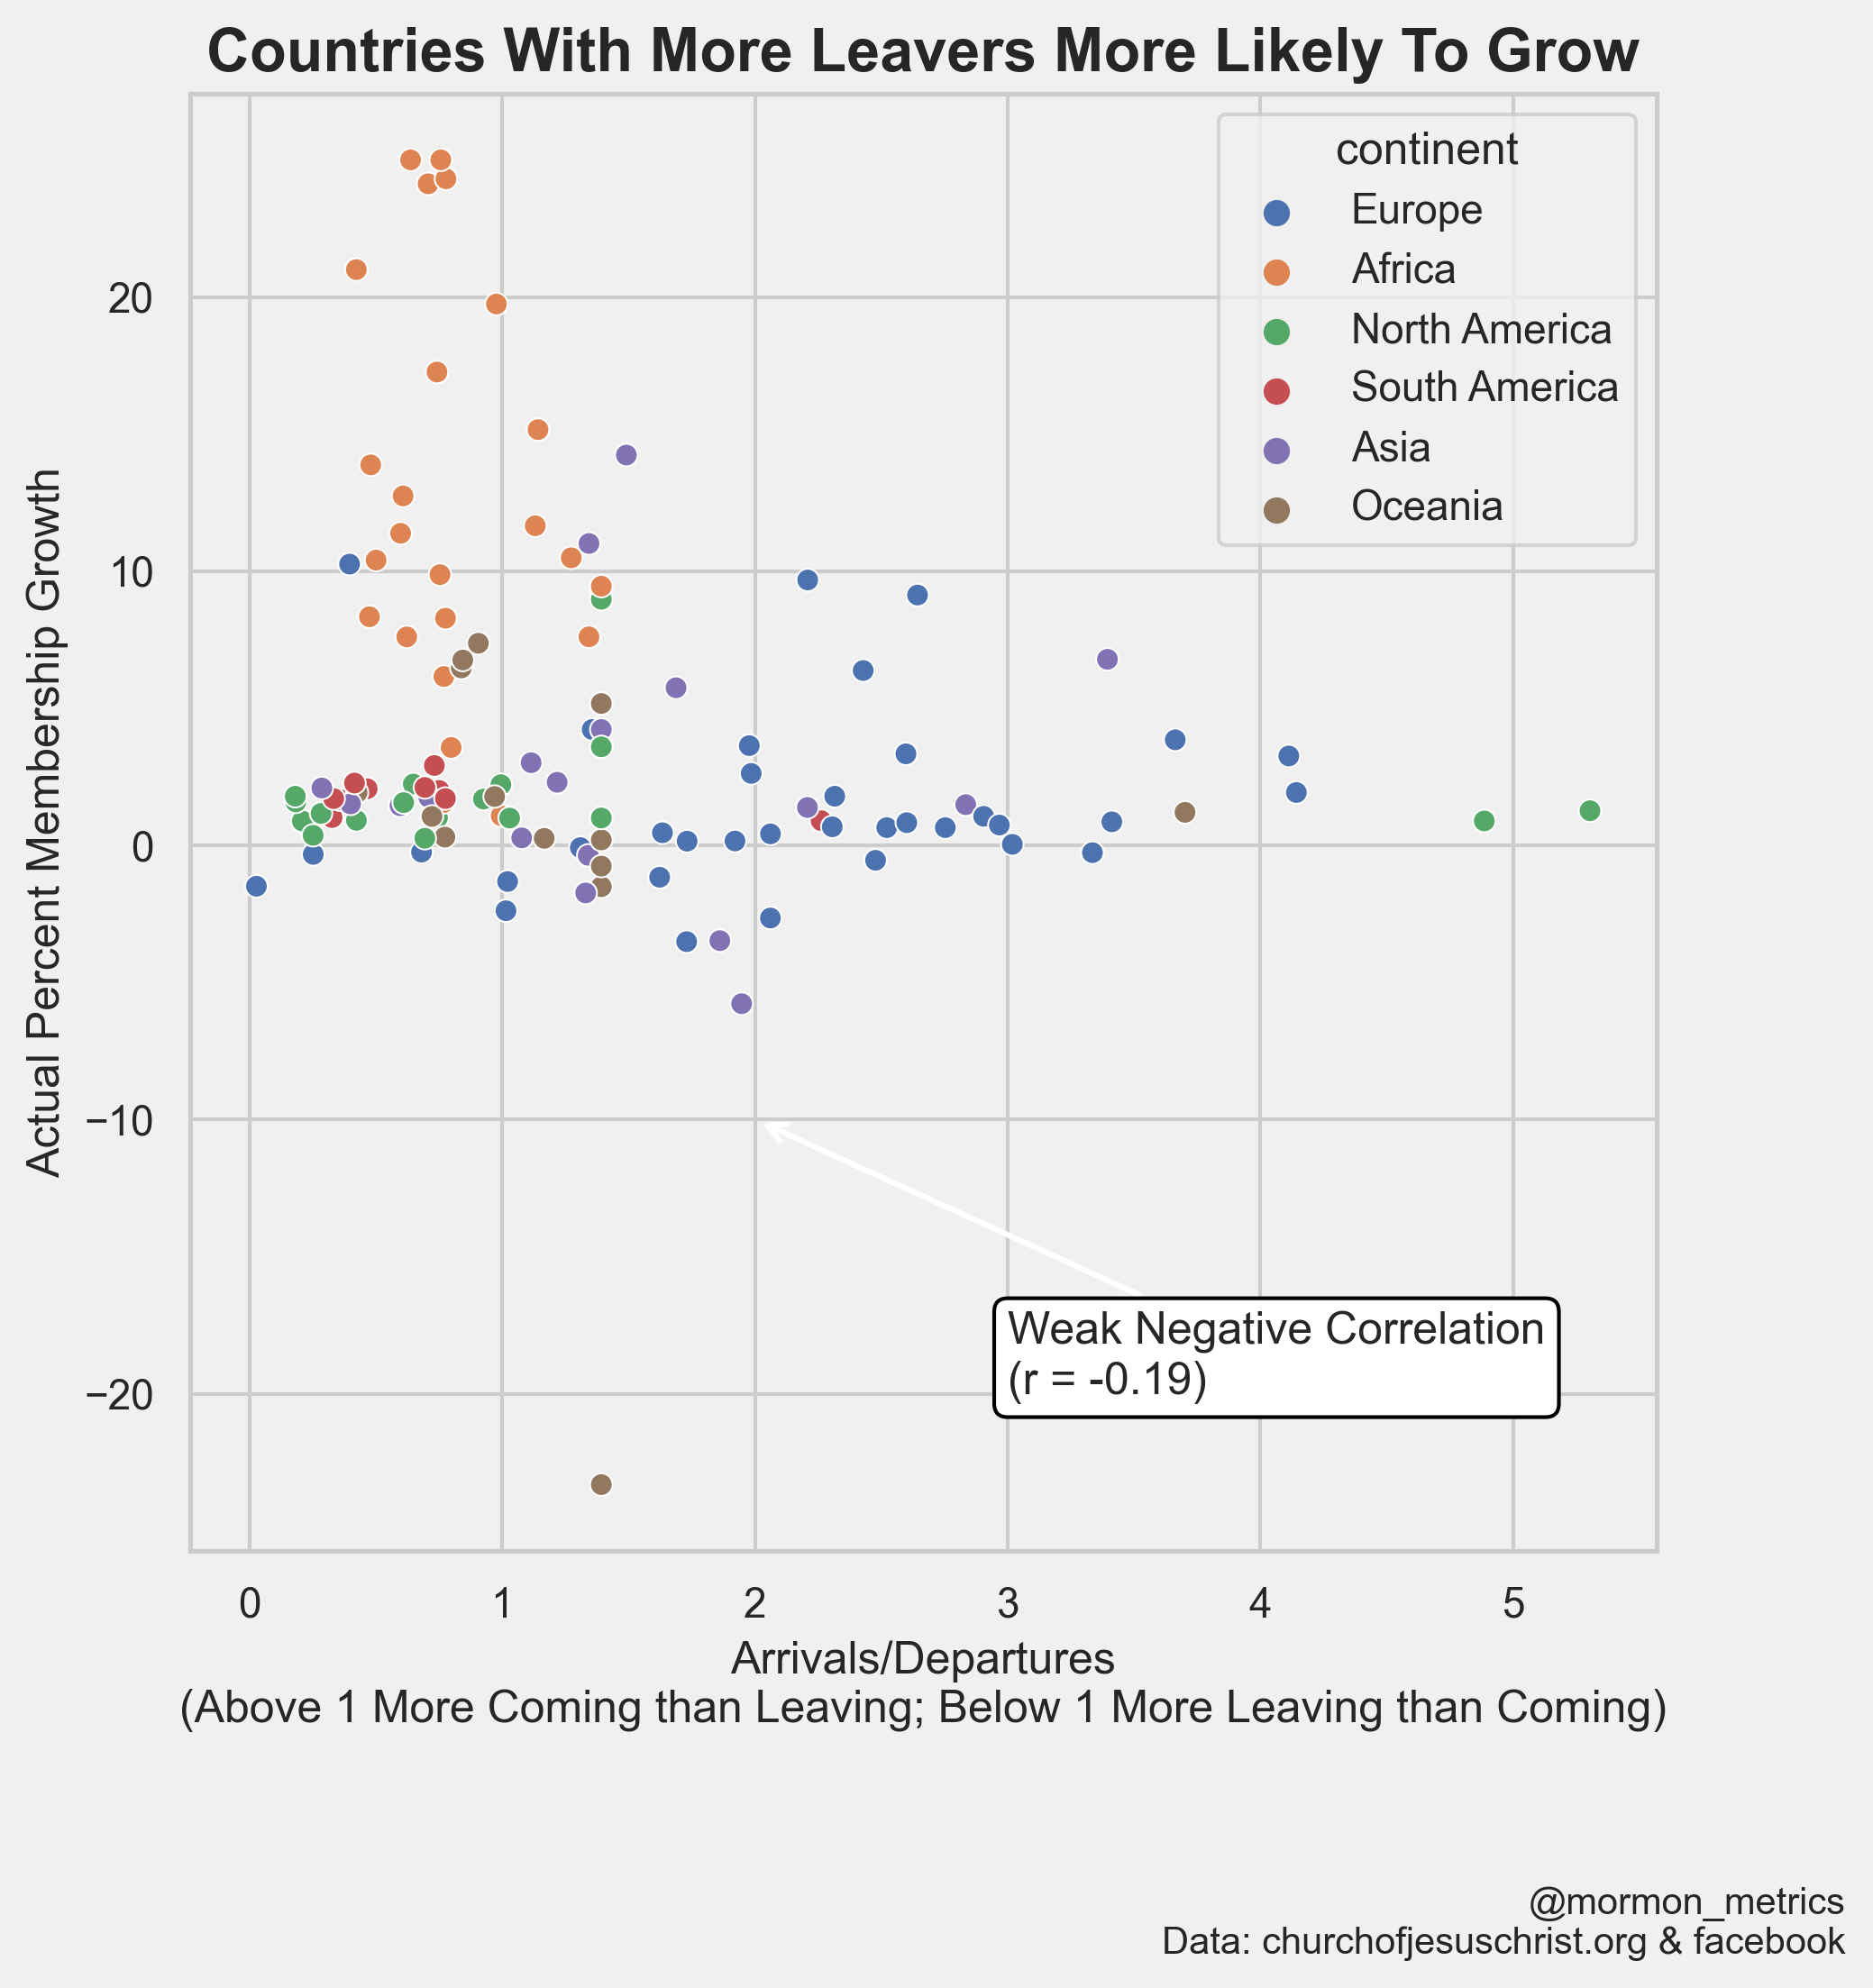
I graph a ratio of entering/exiting above. Numbers greater than 1 represent more people coming into the country than leaving and vice versa for numbers between 1 and 0. Let me point out a few things:
Counterintuitively, many of the countries where people are exiting more than entering are the largest growth areas for the church!
There are definitely regional immigration trends. Particularly in Africa and South America more people leave than come in the country. Conversely, in Europe, more people are coming in than leaving. This part tracks with my intuition.
The top 5 countries where more people enter than exit in order are… Canada (5.3 people enter for every person that leaves), US (4.8), Portugal(4.1), Poland(4.1), and Australia (3.7). These have all been slower countries for Church growth - particularly the US. To me this either suggests that the proportion of Mormon immigrants is extremely low or the church is decreasing even more than you might think in these regions and immigrants hide it.
You may notice some green data points in the more exits and entering group. These are nations in the Caribbean and Central America.
Now let’s look at birth rates against church growth rates…
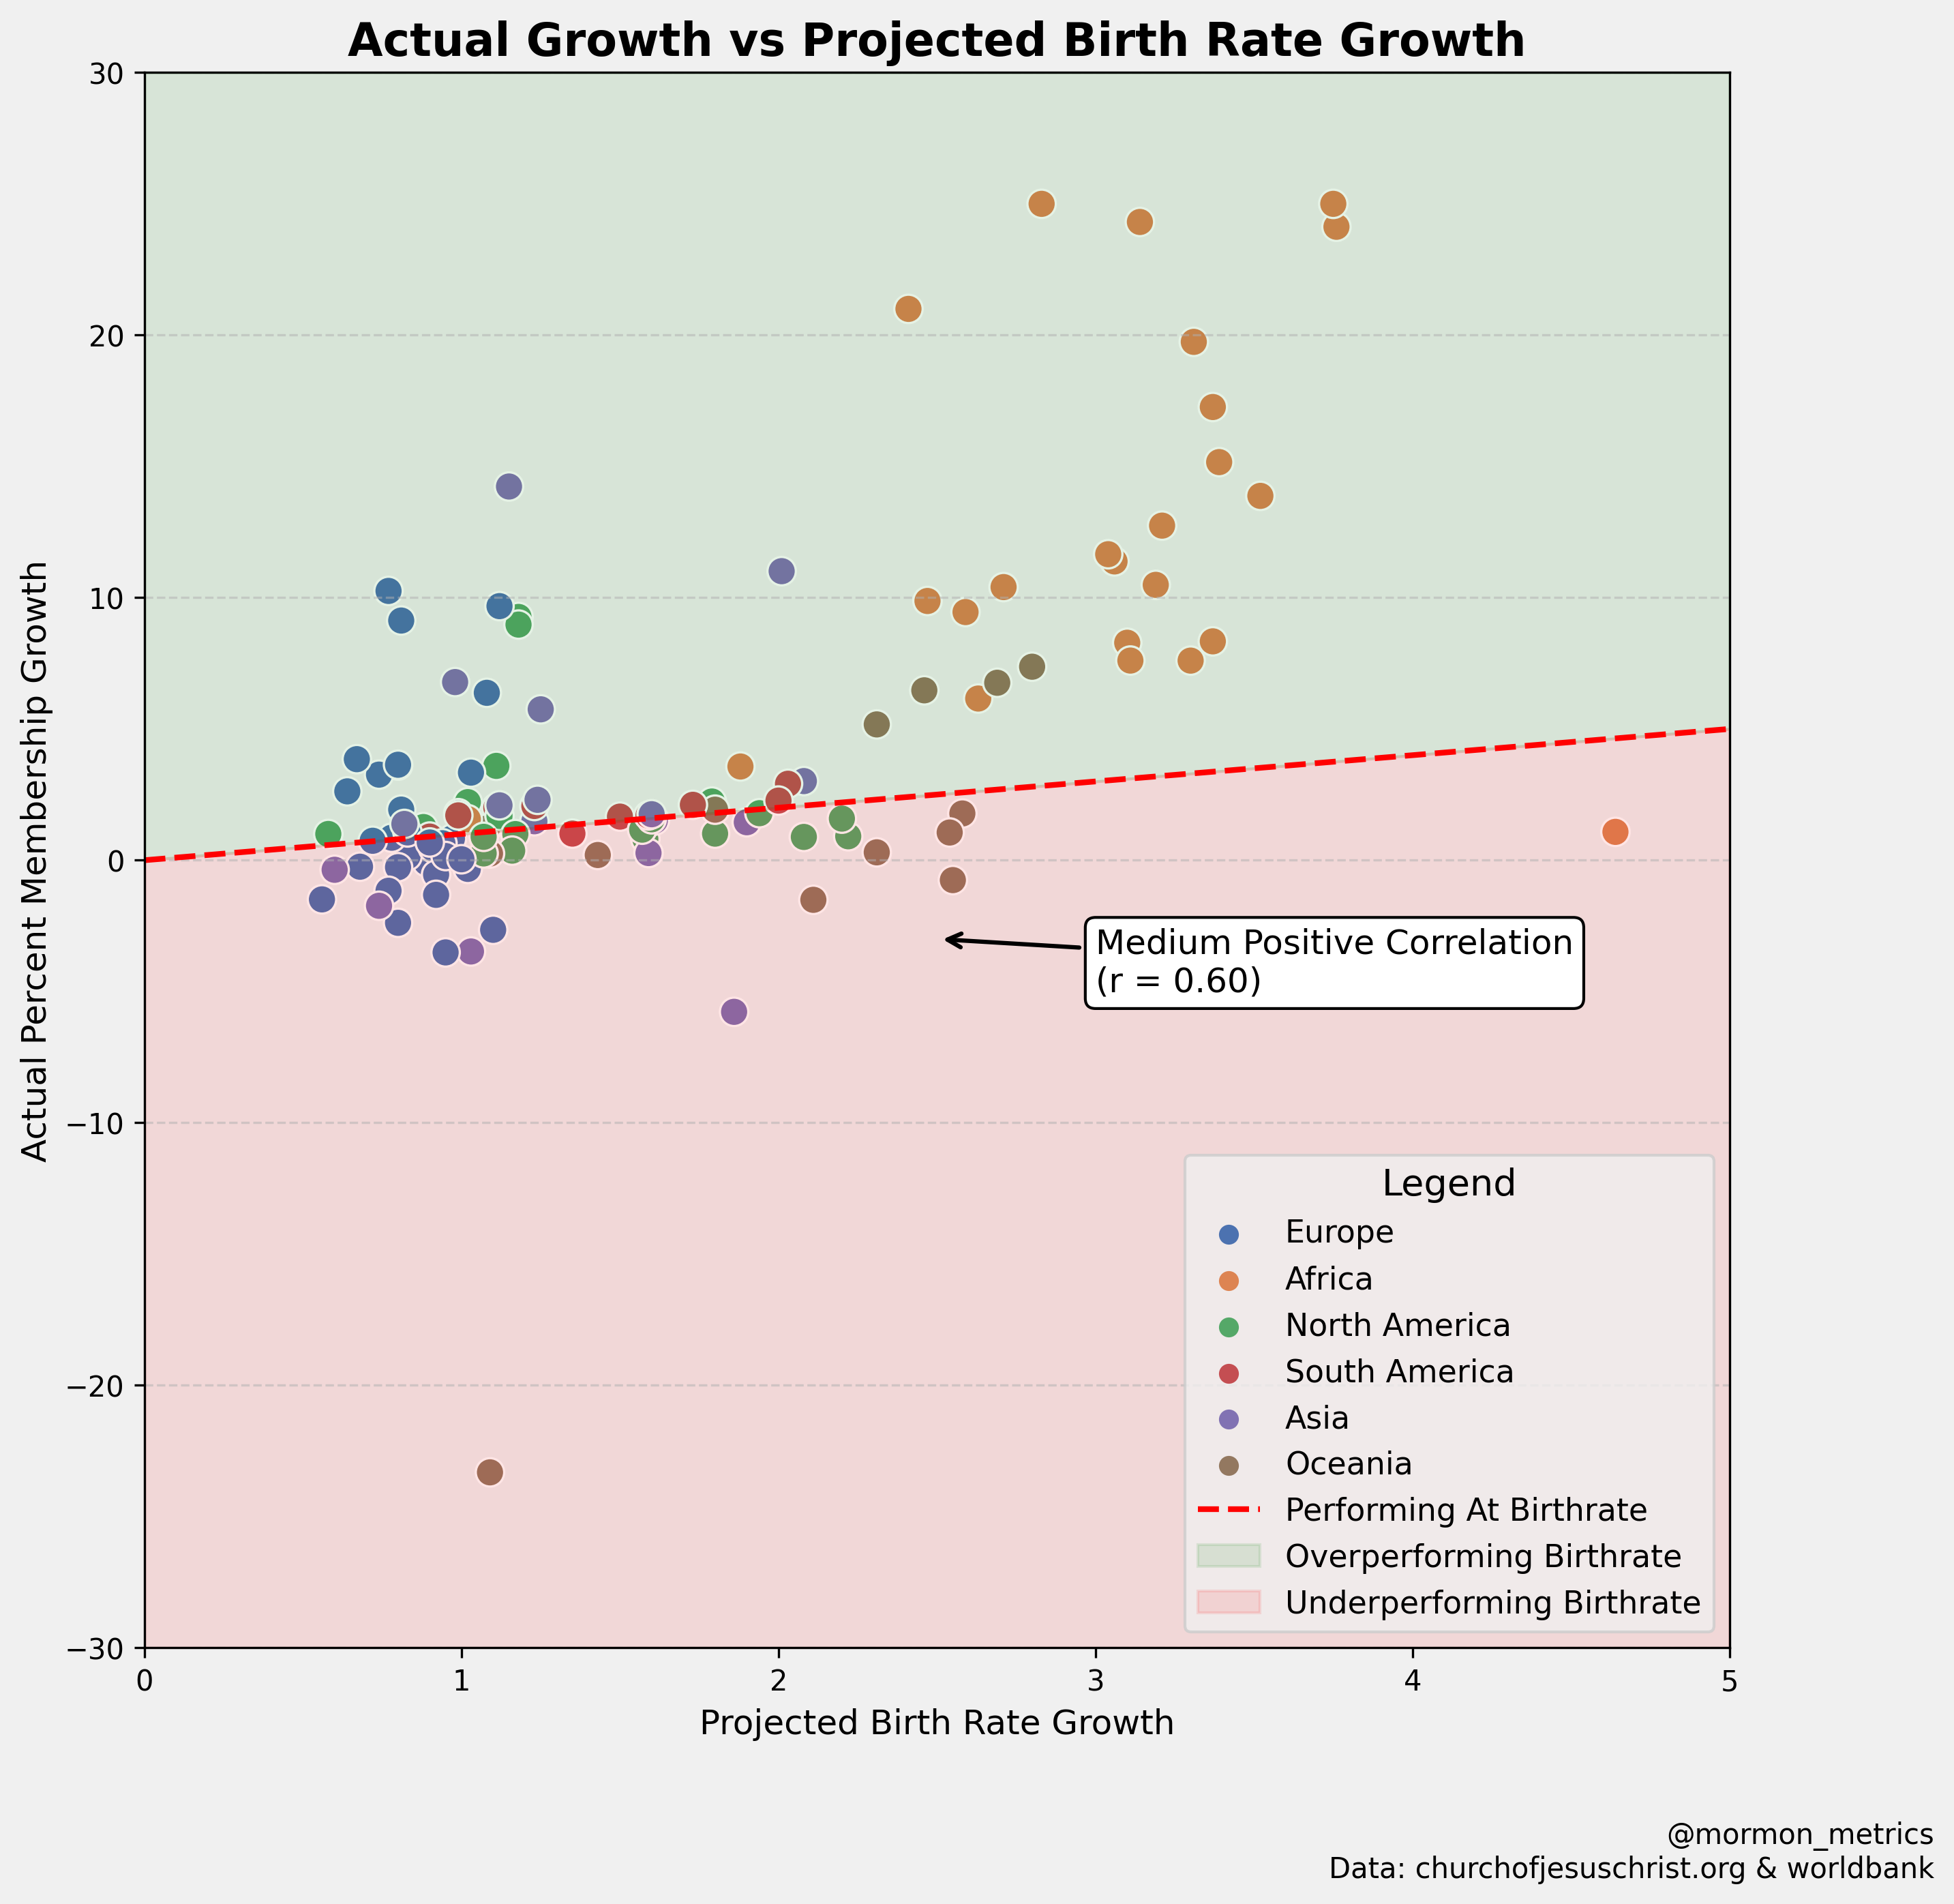
Methodological note: To create the Projected Birth Rates, I took the country’s birth rates and applied it to the total church membership in the year previous then calculated the percent increase from just births assuming the members have the same birth rate as their country.
Ok a few notes:
Overall, there is a pretty strong correlation between church growth and birth rates (0.6). To me, this suggests that cultural/national factors influence the number of children members choose to have. It’s not just a flat rate for all members!
Even though Africa has high birth rates, the church growth is clearly outperforming the birth rates!
Some regions have more variance for outperforming the birth rate. Europe has consistently lower birth rates than other continents, but varies on out performing and under performing it. Ireland, Italy, France, Portugal, and Spain all outperformed the birth rate which is an fact encouraging for this region. On the other hand, South America seems to tightly hug the birth rate line which perhaps suggests more limited convert growth.
The US is close to the line, but underperforming with a projected birth rate growth of 1.07% and actual growth of 0.89%.
Next, I also ran a statistical model predicting what factors influence church growth. So, what factors move the needle?
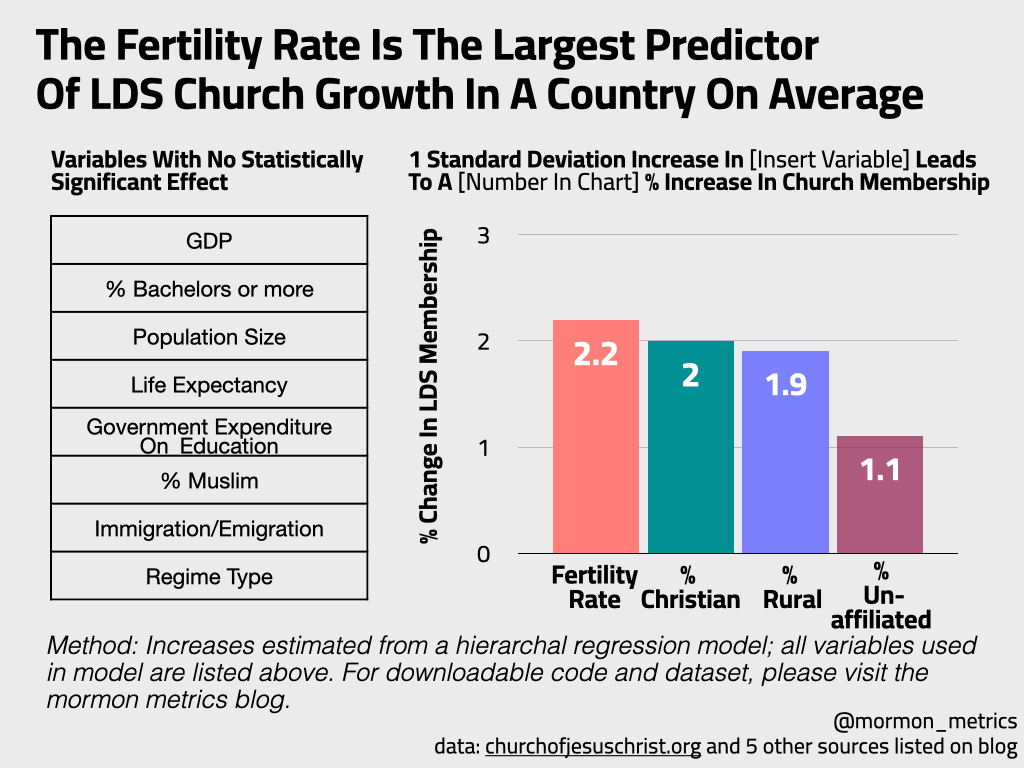
First of all, of all the variables in my model, there wasn’t one with a negative statistically significant relationship. There were several nonsignificant relationships including the immigration variable. Once you control for other factors, the immigration/emigration negative correlation we found earlier was not meaningful.
I did find 3 positive statistically significant relationships. Fertility rate was the most predictive of church growth followed by the % of estimated Christians in a country, then the % of people living in a rural area and lastly the % unaffiliated from all religion.
You may be surprised to see that if a country has more people unaffiliated from religion that the the church is more likely to grow there. I was not surprised by this only because when I built a model predicting leavers, the most likely religion to join the church was those unaffiliated from religion. Read more in the link:

Conclusion
So what did I learn?
Fertility rates are the most predictive factor in whether the church grows in a region or not. Other factors are relevant as well too like the proportion of Christians living in a country or if there are a lot of people without a religion.
Immigration/Emigration flow was not predictive of church growth. In fact, I saw the opposite relationship of what I expected: Some countries with the most immigration flow see very slow church growth rate and many countries with high emigration flow see fast growth rates. When you include other control variables, we don’t see a significant relationship between immigration/emigration flow and church growth in 2024 (though it is surely related in some cases throughout history for fact).
As a subscriber suggested to me, comparing the church growth rate to whether it outperforms it's birth rate seems to be a good measure of a country’s overall growth health. There are many cases of a country’s membership growth outperforming the birth rate - especially in Africa, but also in countries in Europe! For example, Ireland, Italy, France, Portugal, and Spain all outperformed the birth rate and suggest a healthier growth rate than stereotypes of Europe suggest.
What do you think of this analysis? Is there anything I missed in the data or something you would add? I love hearing thoughts and ideas from readers, so let me know in the comments (a lot of my future posts come from reader’s curiosities) 🙂
If you are a data person, I included links below in the appendix to where I obtained all of my data as well as a link to my cleaned dataset, and the script I used for my analysis. It should all be completely reproducible if you are working on something related or just want to check my work 👨💻.
Limitations, Caveats, & Future Ideas
Combining all these data sets came with some challenges one of them being that the years didn’t perfectly align. For example, the most recent Facebook immigration data was from the Year 2022 while our data church data was from 2023 and 2024. All of the years will be close (None below 2021), but not all of them match up perfectly. My hope is that in general the signal behind these metrics is more stable than variant and won’t change much after only a year or two. Though if a country has change significantly in the last 3 years, we should be thoughtful in how we interpret those cases.
One variable I hoped to analyze, but ran out of time was how long the church has been in a country. Also if I had more time I would have looked at whether countries with stronger ties to the US see higher growth rates.
I would have like to use survey data where people self report how much they value religion by country or how often they attend church, but I couldn’t find a survey large enough (largest one i found was 64 countries but we have about twice the number of countries with our church data and I didn’t want to exclude half of our dataset). It would be interesting to see an analysis of these 64 countries with some rich survey data!
Appendix
Access the cleaned dataset here and code I used to analyze the data here.
I joined data in from several places. I used…
Immigration data from Facebook
Religious Composition Estimates from Pew Research Center
Education, Fertility, Population, Life Expectancy, % Rural, and GDP per capita ($) from UNESCO Institute for Statistics.
Regime type/Freedom Scores from Freedom House
Crude birth rates from the World Bank
Church Membership data scraped from here and stored/accessed here.