
Two Kinds Of Growth: A Story Of Worldwide LDS Membership Growth The Last 14 Years
Explore the worldwide LDS dashboard launched today!


Find my newly launched dashboard linked at the bottom of this article and explore church growth for yourself. Click on your favorite country or US state and analyze 15 years of data 🙂
Most active members have had a version of the experience where they look through the ward list on LDS Tools and don’t recognize many of the names from their local ward. Perhaps some people on that list are active weekly attenders, but quietly come and go for church meetings. Others may attend every once in a while, but don’t draw a lot of attention. Some moved and didn’t take their records with them. Some were baptized as teenagers, but drifted before you ever met them. Clearly, the roster and the pews are different lists. When you separate membership growth from congregational growth and look at the two side by side, the global 'growth story' breaks apart into five or six distinct regional stories — some of them genuine expansion, some of them contraction hiding inside an accumulating roster. Let’s break it down region by region.
For this analysis, I looked at the last 14 years (2011-2025) of church membership record data by country. This data is from churchofjesuschrist.org in their worldwide country breakdown page over time.
Absolute Change in Members — South America Leads the Way
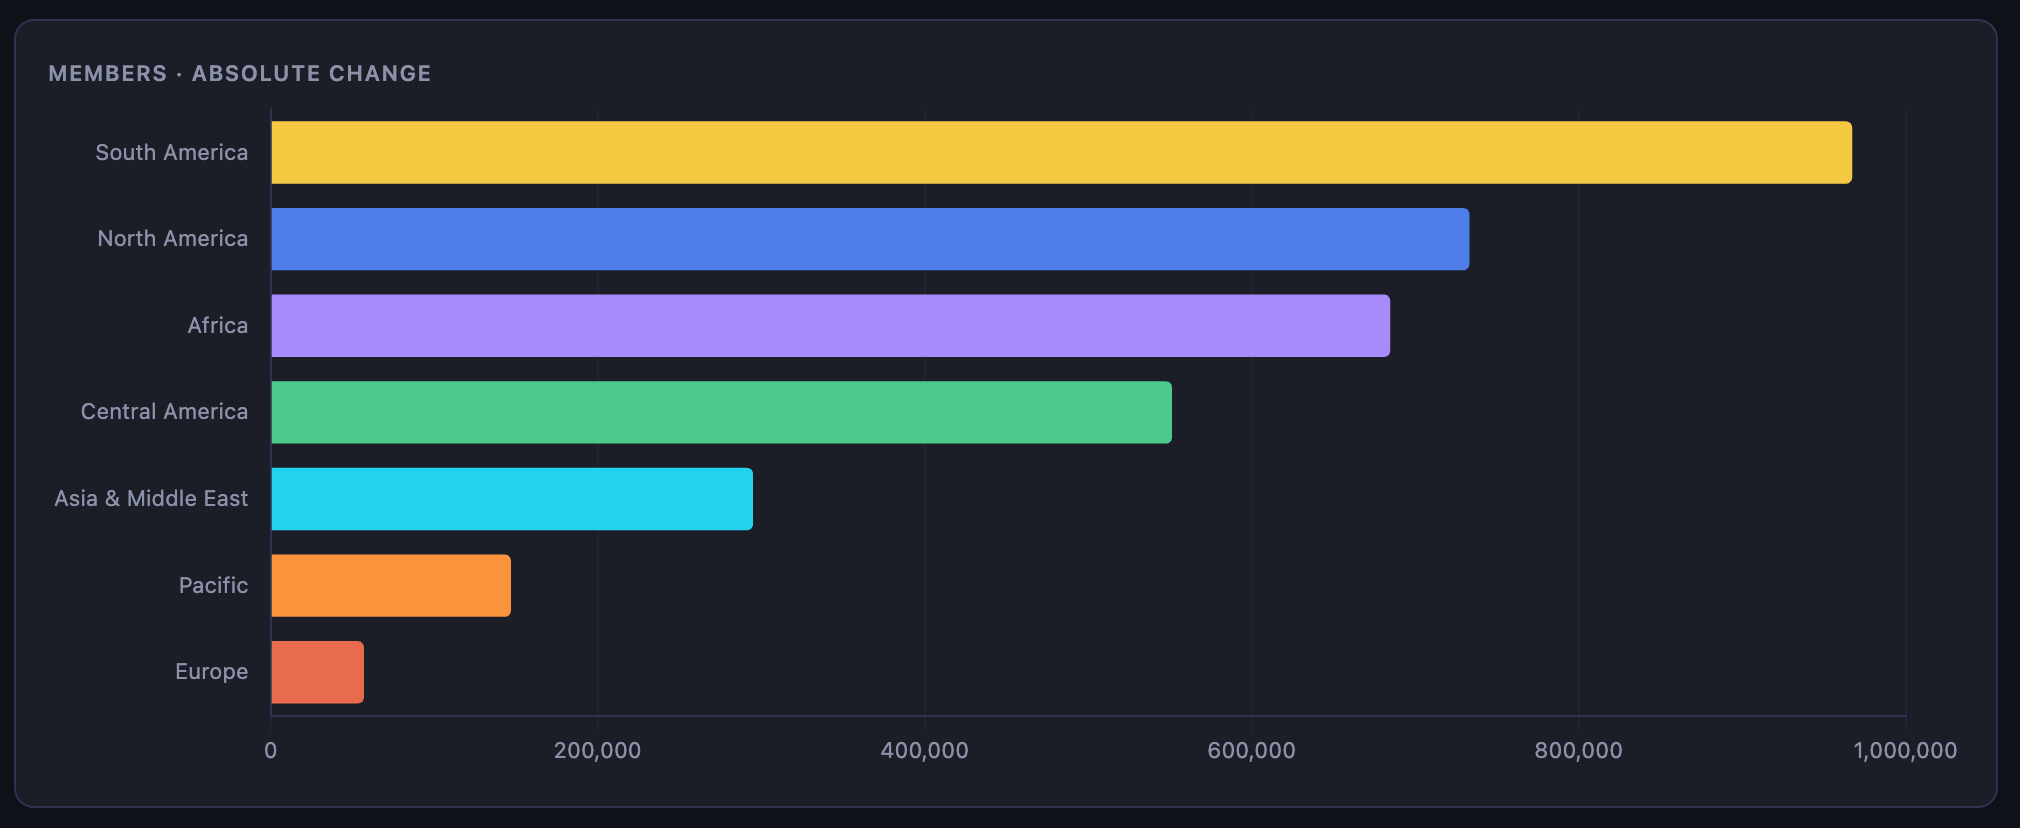
Over the last 14 years, the Americas and Africa have seen the highest absolute number growth where Asia, the Pacific, and Europe saw the least.
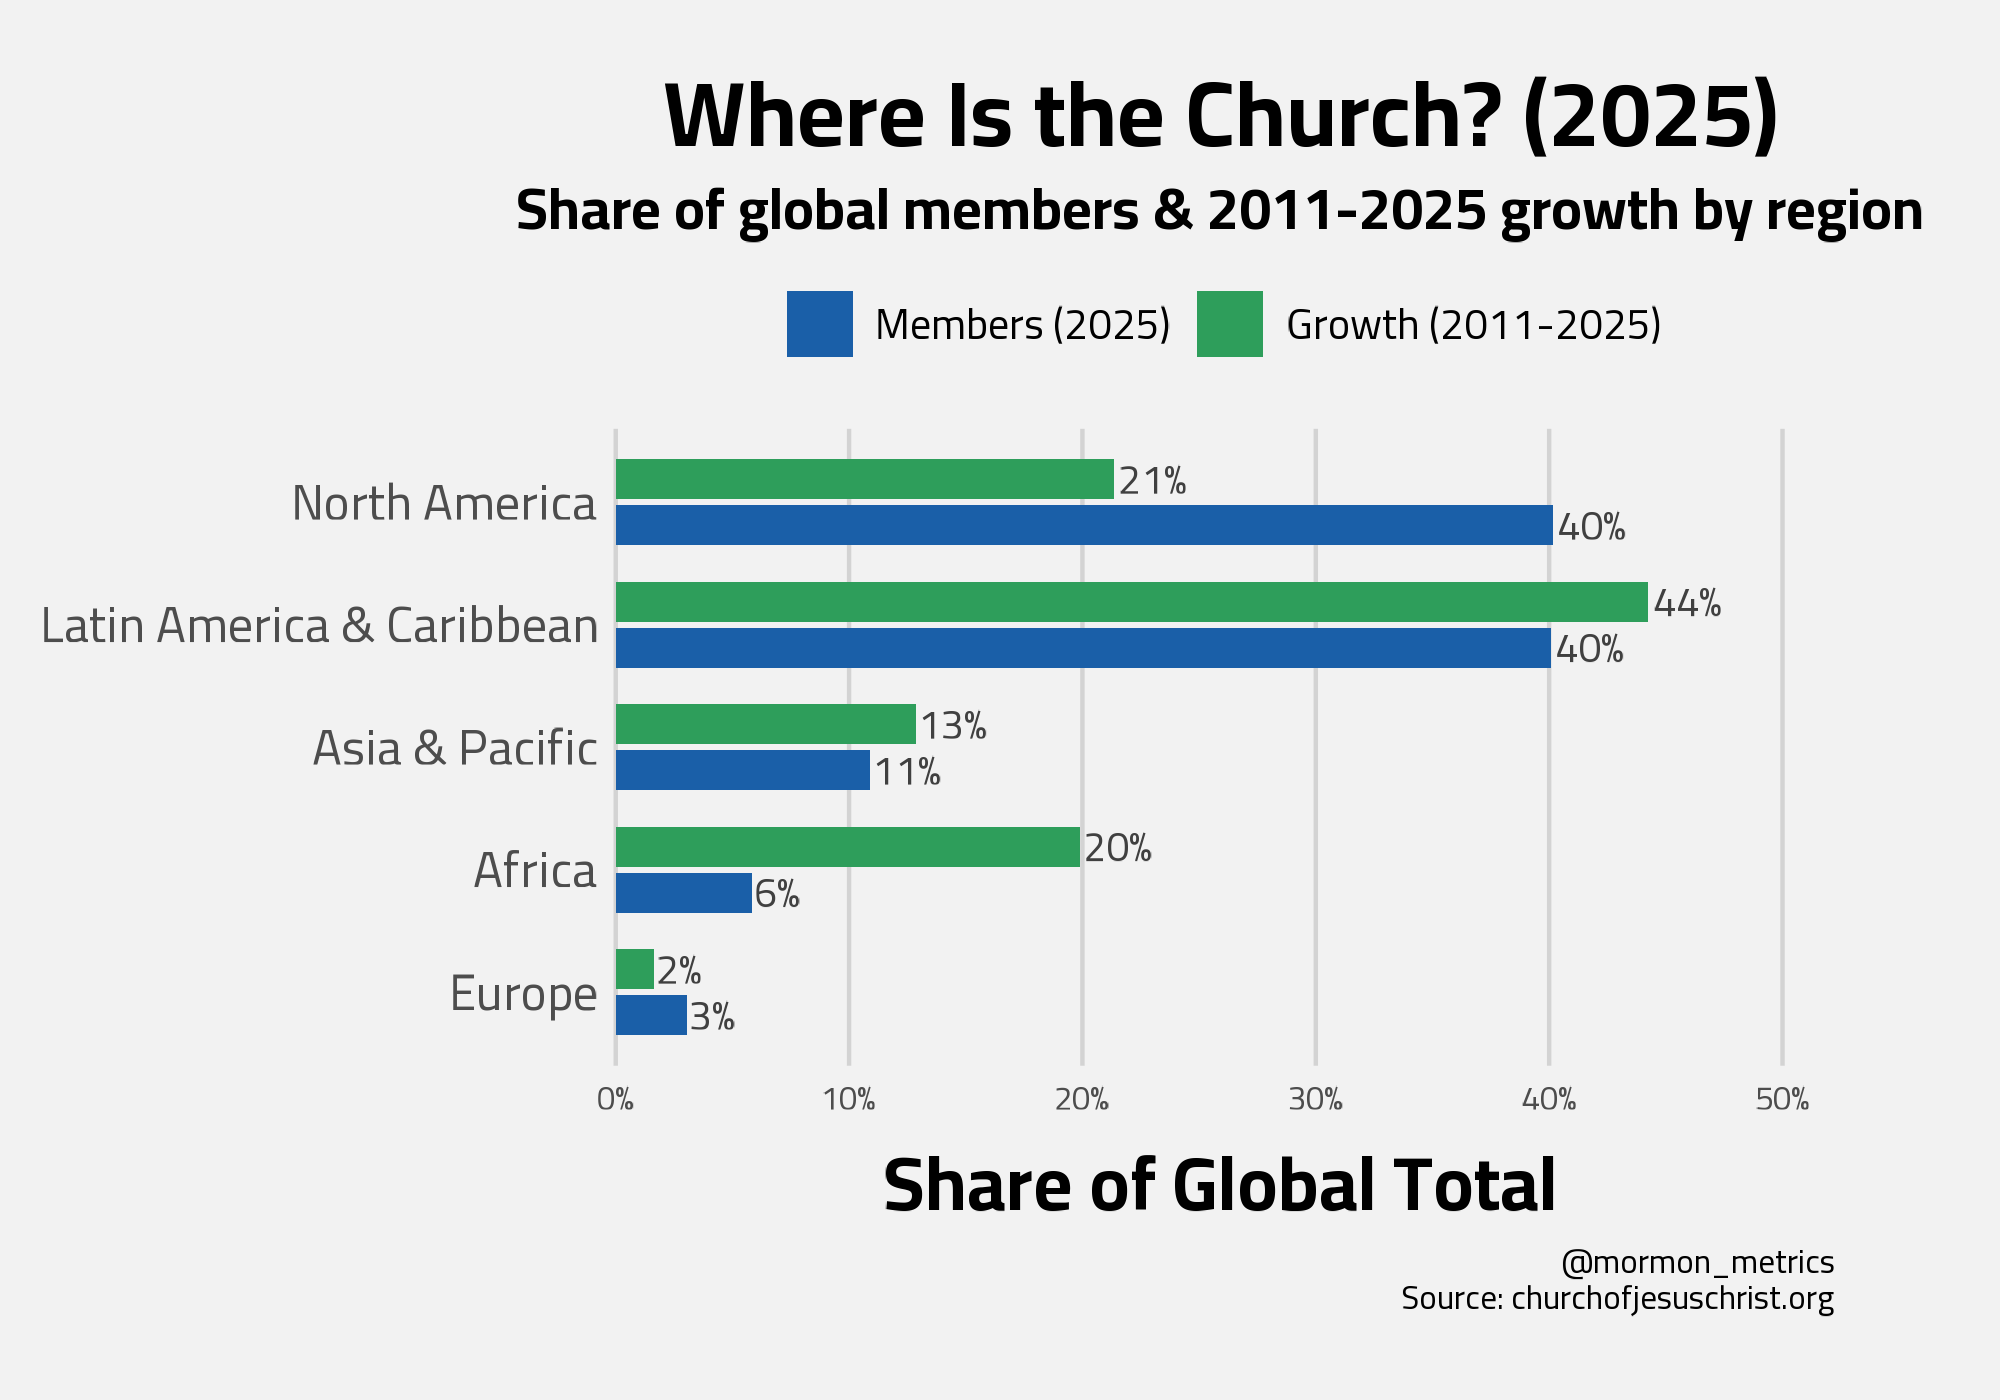
Looking at this chart, you can see how much Africa is punching above its weight in growth! Africa represents 6% of the total LDS population in 2025, but 20% of global growth the last 14 years.
Just to contextualize its significance, when you think about growth in a country/region, you should be thinking about at least 3 things…
missionaries (the more proselyting missionaries the more people may be converted)
members (the more members theoretically the more friends of members that might get converted)
birth rates (the more births the more membership growth)
While Africans have a higher birthrate on average which is likely driving some of this growth, the other two metrics are stacked against Africa.
Africa has only a fraction of the membership base of North America. In 2025, Africans made up 6% of the LDS world population vs. North Americans making up 40%.
Africans see far fewer missionaries than North Americans see. In a previous analysis of 2023 data, I estimated that North America makes up 37% of the missionary population while Africa only makes up 12%. (read more in the link below for that analysis)

Yet, Africa saw just about the same number of absolute growth as North America the last 14 years.
Our next chart is looking at congregational change the last 14 years.
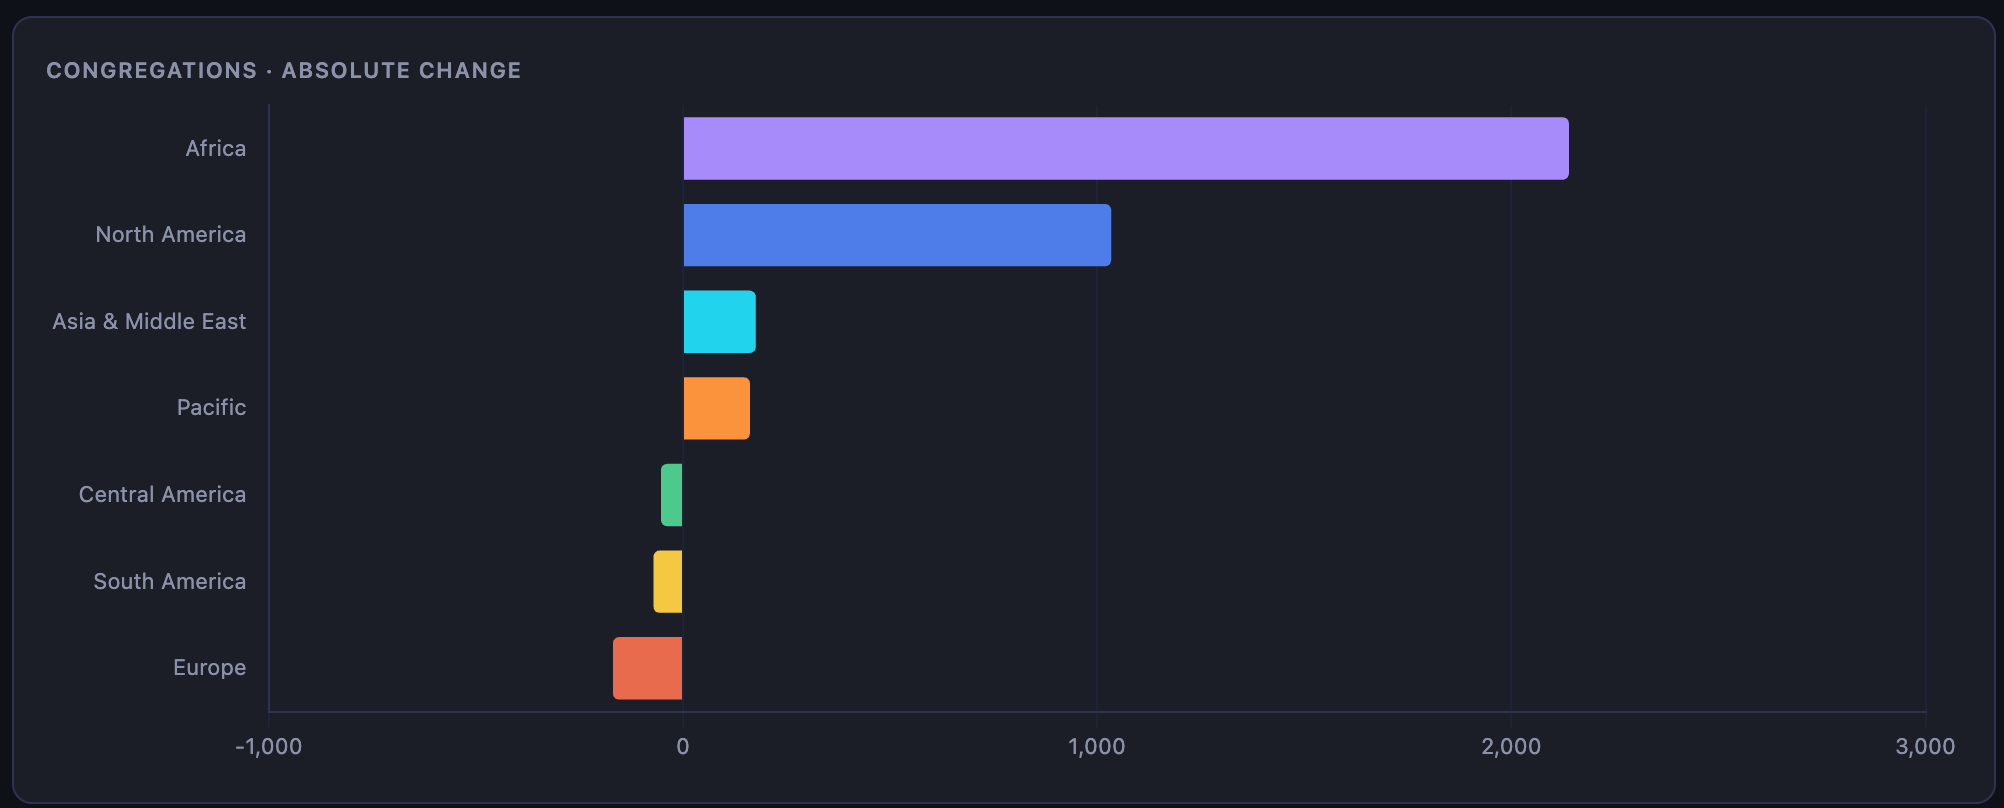
Africa literally doubled the congregations added (over 2000+ congregations) compared to any other region. We see significant growth in North America and Africa, but see some warning flags in Central and South America and Europe who all net lost congregations in the last 14 years.
Put the two charts side by side and each region's story becomes legible in a way the global number hides.
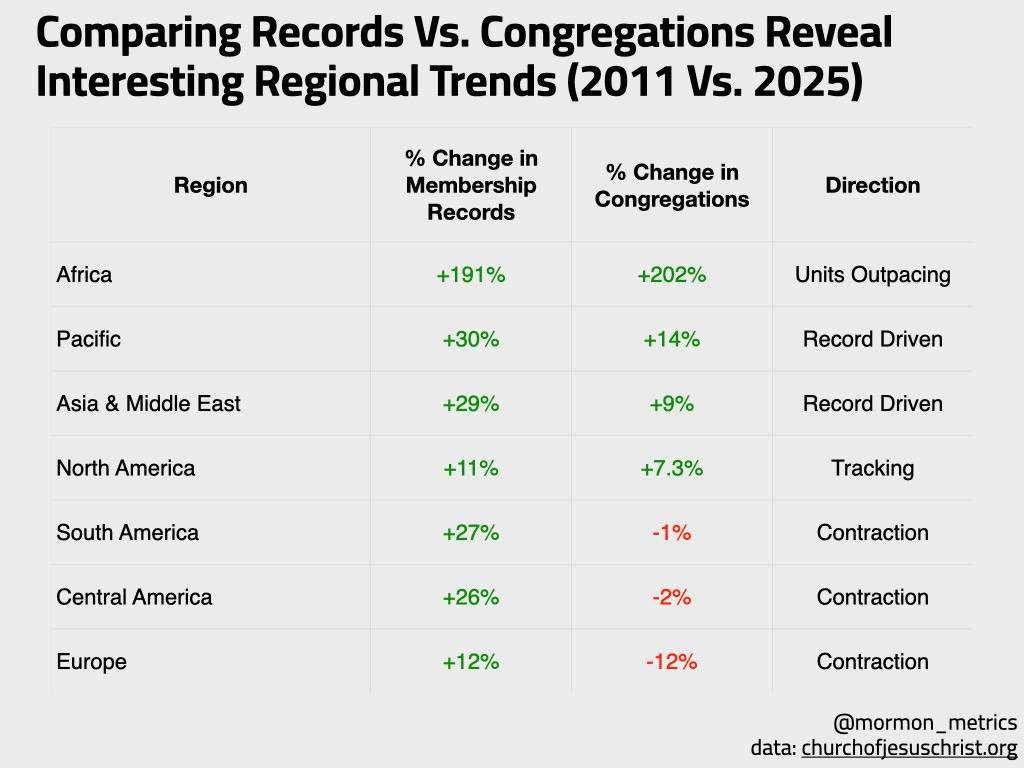
Lets talk region over region:
In Africa, congregations have outpaced membership change! Both are very high. Africa has a higher proportion of branches to wards and because branches are smaller, you can create more of them per unit of membership growth which helps explain the rate of congregations outpacing the rate of members.
Pacific + Asia & Middle East have seen more membership growth than congregational growth, but seeing congregational growth none the less.
North America has tracked pretty well over the time period — not as much membership growth as other regions but steady congregational growth.
Central and South America are seeing growth similar to other regions and double that of the US, but have lost congregations in that time period. Very clearly signaling membership retention problems in the region.
Europe looks the most dire with among the lowest record growth and a loss of more than 10% of congregations.
I built this dashboard because the regional stories above are just the starting point. The country-level and state-level data tells sharper versions of each of them — Brazil vs. Chile, Utah vs. California, Ghana vs. Nigeria. Pick your country. Pick your state. Fifteen years of data, multiple metrics.
Click here for dashboard 🔗🔗 Please view on desktop if possible!
I will note that in talking with friends who work for the church in Central America there has been a shift in philosophy about the size of congregations. I’m told that where before the policy was smaller congregations to increase ward level leadership opportunities, now there is a preference for larger (North American sized) units on the basis that there is strength in numbers. For example, as a missionary there in the early 2010s, my experience was that the most established units had at most 10-15 youth total. By combining congregations they can double and triple that number and thereby have a more robust ward level youth program. By contrast, growing up in Utah I had 20 boys in just my deacons quorum.