
The United States Is Declining In Official Membership For The First Time. Why?
Exploring this question using the newly released dashboard


I used the new dashboard I released last week to write this post up. Answer your own LDS data questions by exploring the dashboard. View on desktop for the best experience.
While there have been notable increases in LDS membership in many countries world wide, for the first time, the United States has decreased in official membership.
Is the membership in states declining together? Or are there certain regions/states driving this change?
Our newly released dashboard has data at the US state level. So, let’s use our new dashboard to investigate these questions.
Membership In US Increases Over Time Only Slightly Dipping in 2025
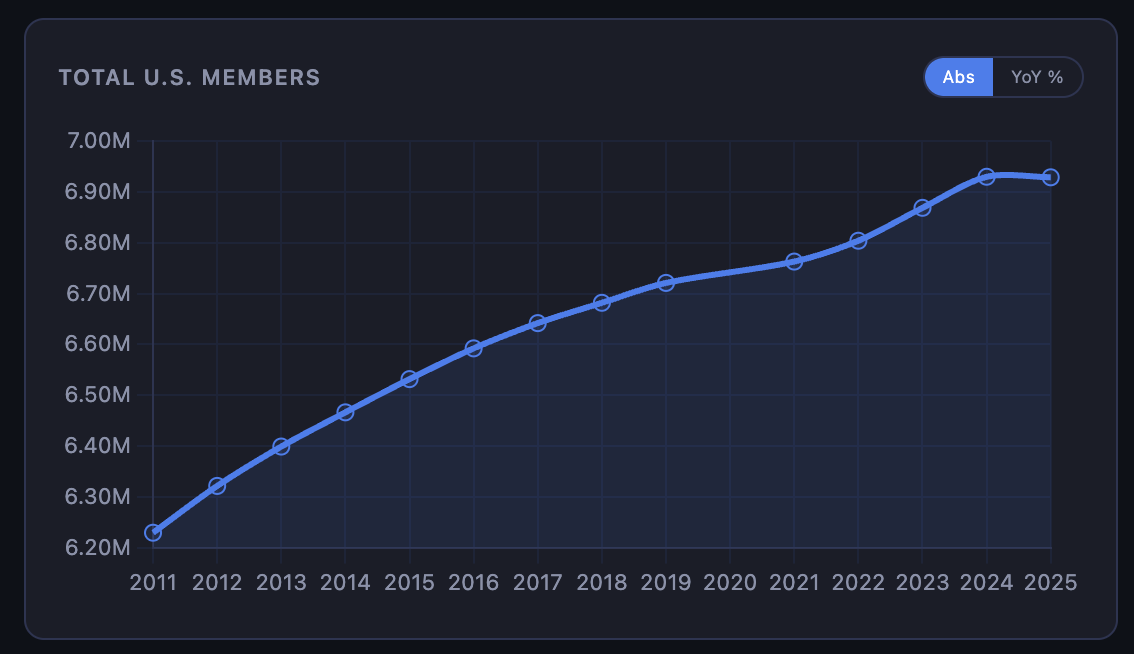
When you look at the US over time, we can see a steady increase in membership over the time period with 2025 having a slight decrease.
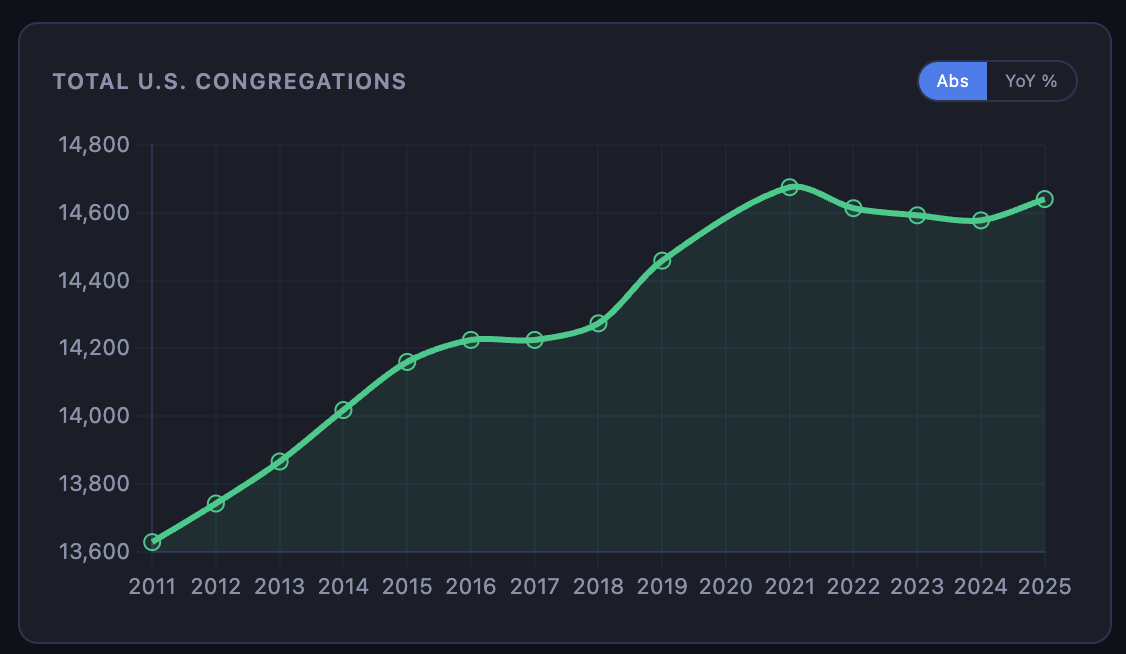
Looking at congregations, while they increased this past year, the previous 3 years saw declines.1
Over 15 Years, 48 States Have Increased In Membership
Looking at the percent change in membership since 2011 to 2025, most states have increased over time. In fact, only two states saw decreases in this time period (California -6% and Oregon -1%). In answering our post’s question you can already see regional differences.

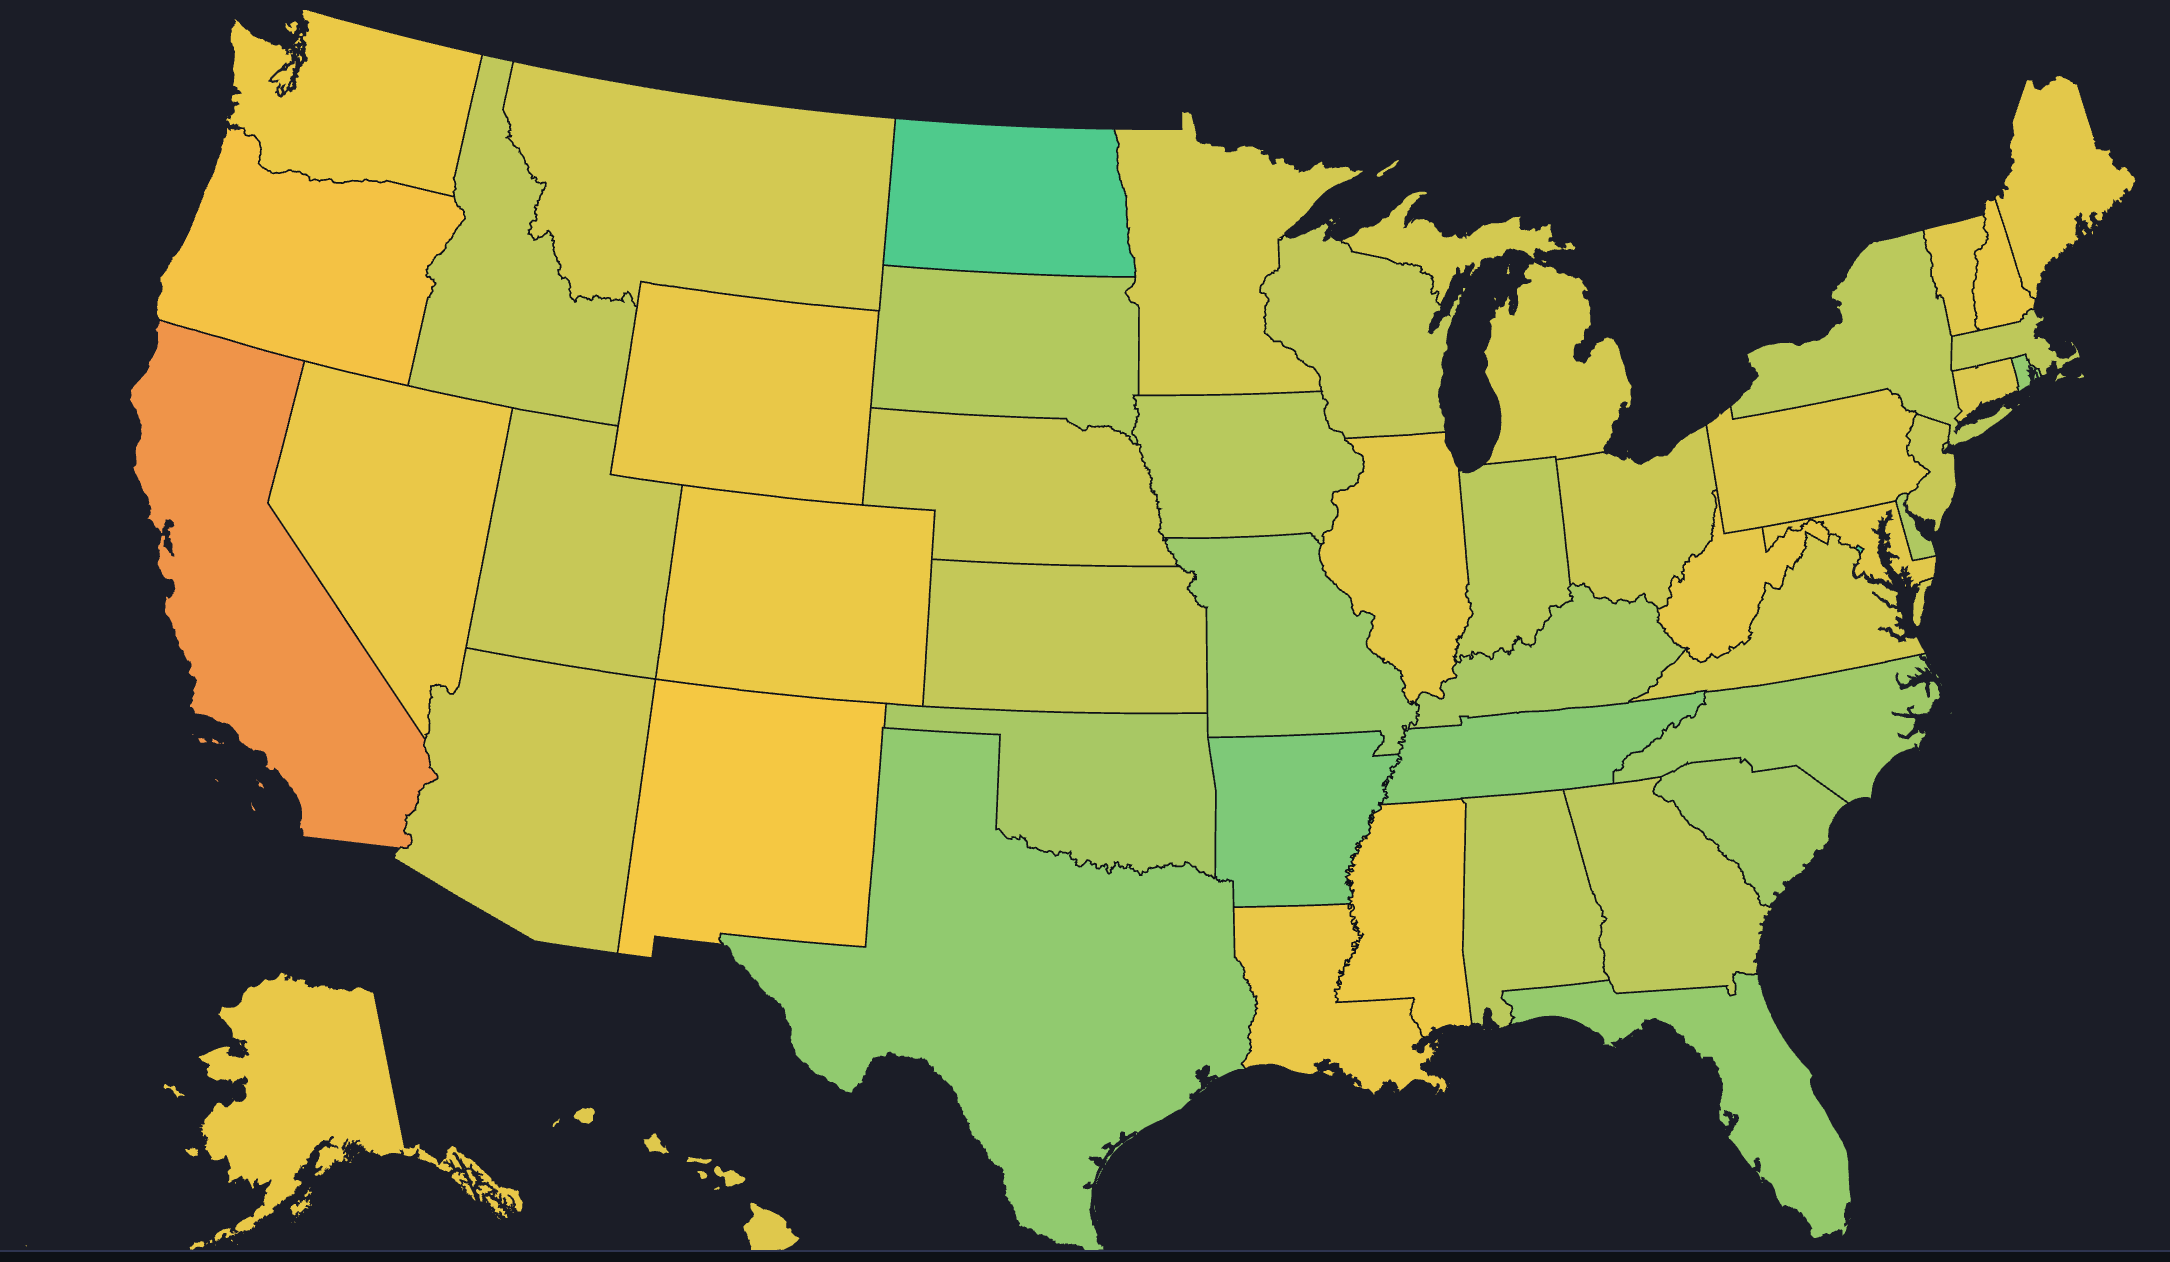
You may say that California is low because people are leaving! And, yes, when you look at migration data, people are leaving CA more so than other states, but over the time period (2011-2025) the CA population has actually increased (2011 it was 37M and in 2025 39M).
From this map you can start to see the regional picture, the yellow and red states are more likely found in the West and the Northeast.
So above is a 15 year view. What does a year over year view look like? What was driving the change this past year?
Over the last year, 27 states declined in Membership (2024 to 2025)

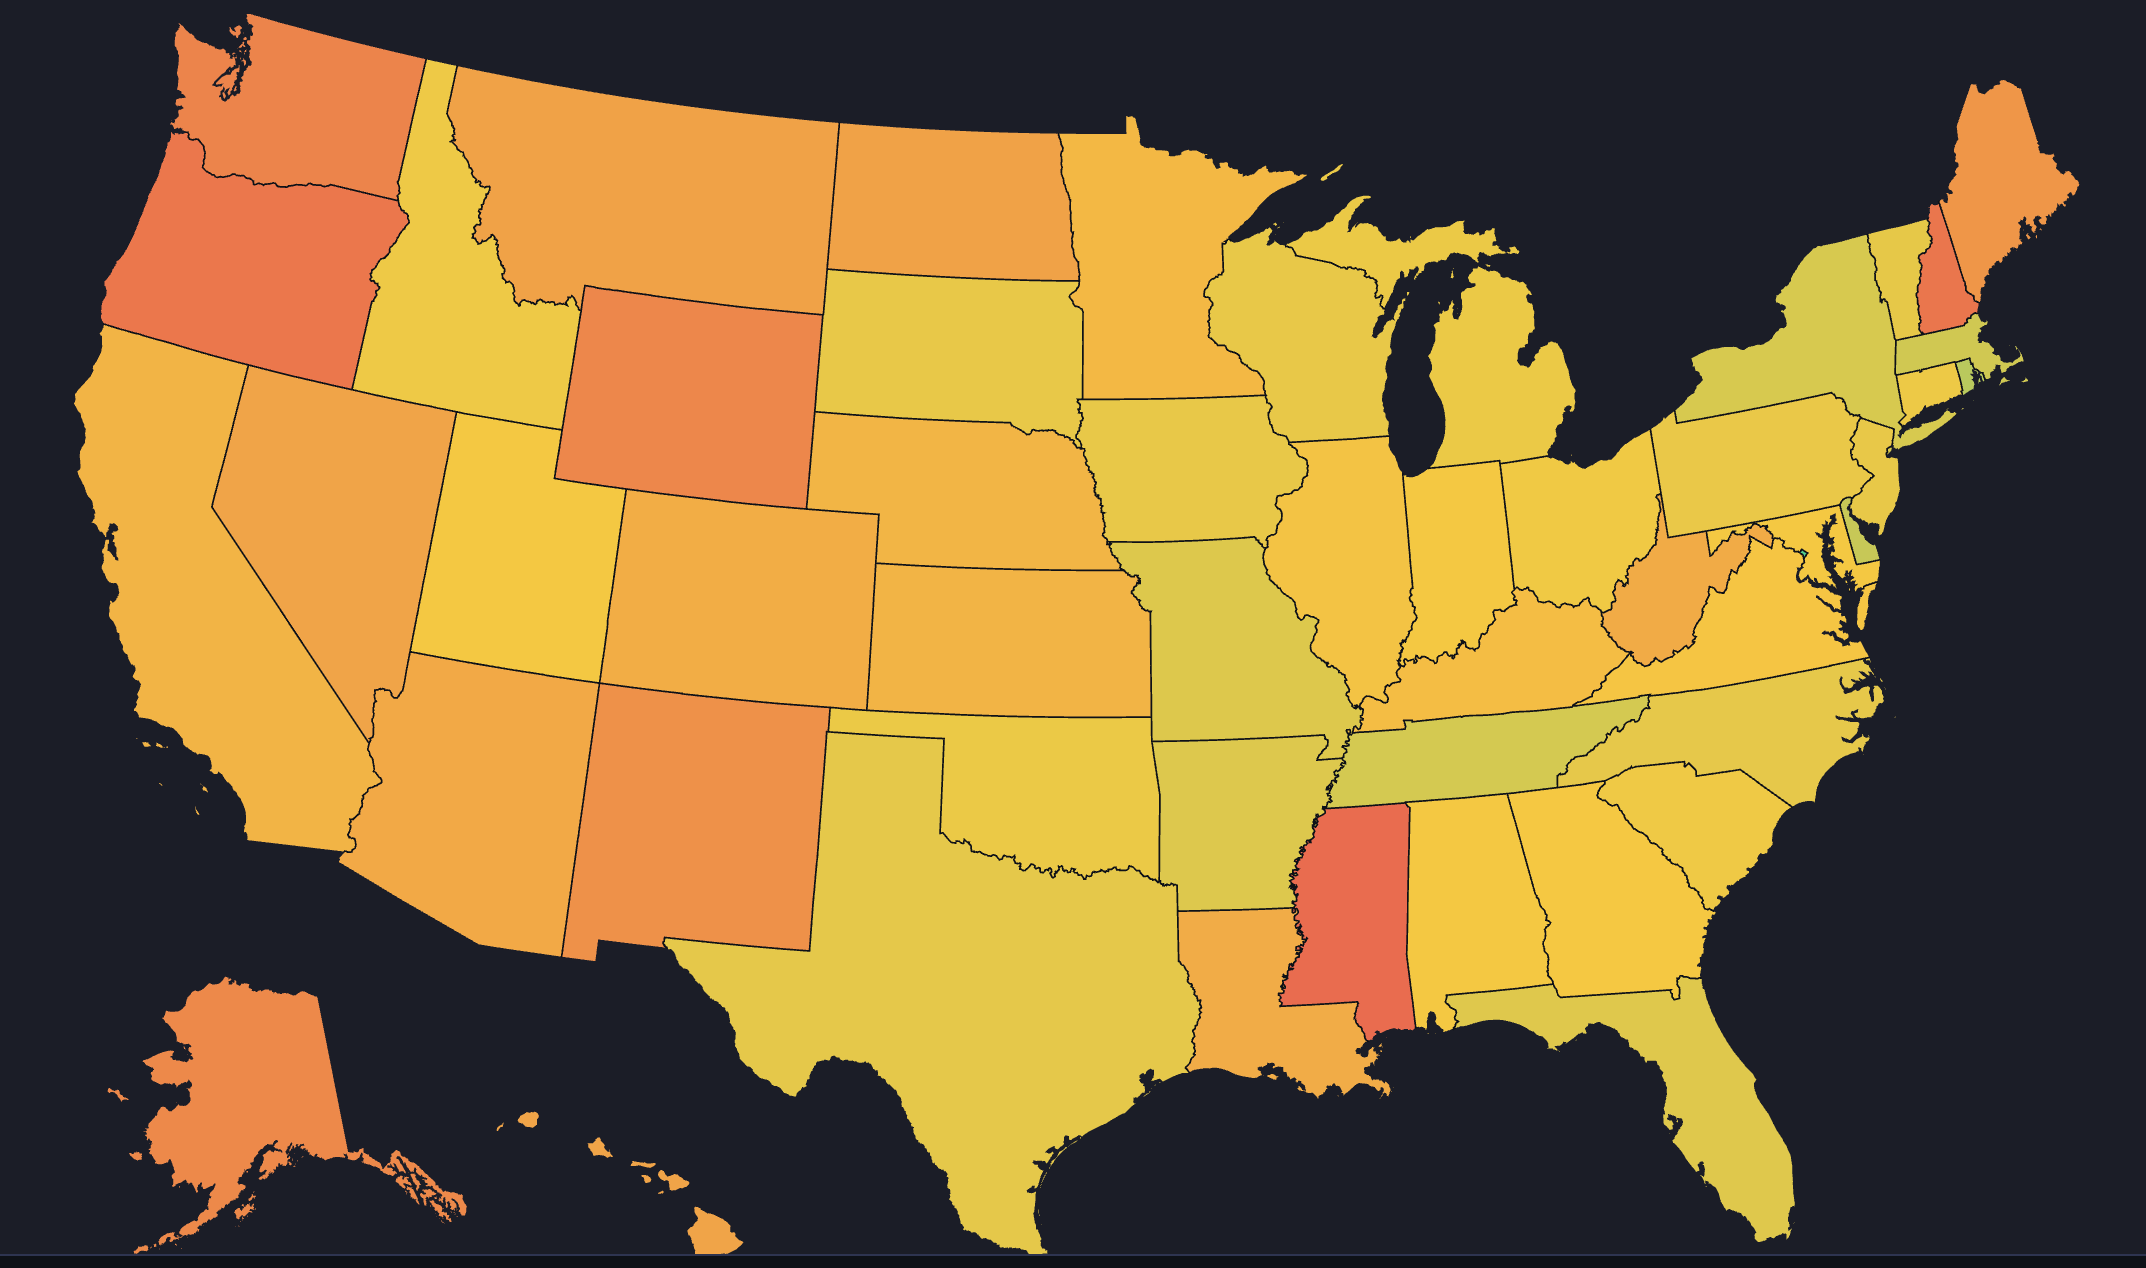
Make sure to note the color scale on this one, the color scale is calibrated so that yellow is always 0% and the lowest number is red and the highest number is green. While its hard to see on this map, Washington DC actually increased 9% in membership from 2024 to 2025 which makes the 1-2% gains in other states look more yellow than green. Find the state by state changes table at the end of the post.
Looking at the YoY change chart, we can see again losses concentrated in the the west and most gains concentrated in the east.
The Western Region Is Driving US Decline in Membership From 2024 to 2025
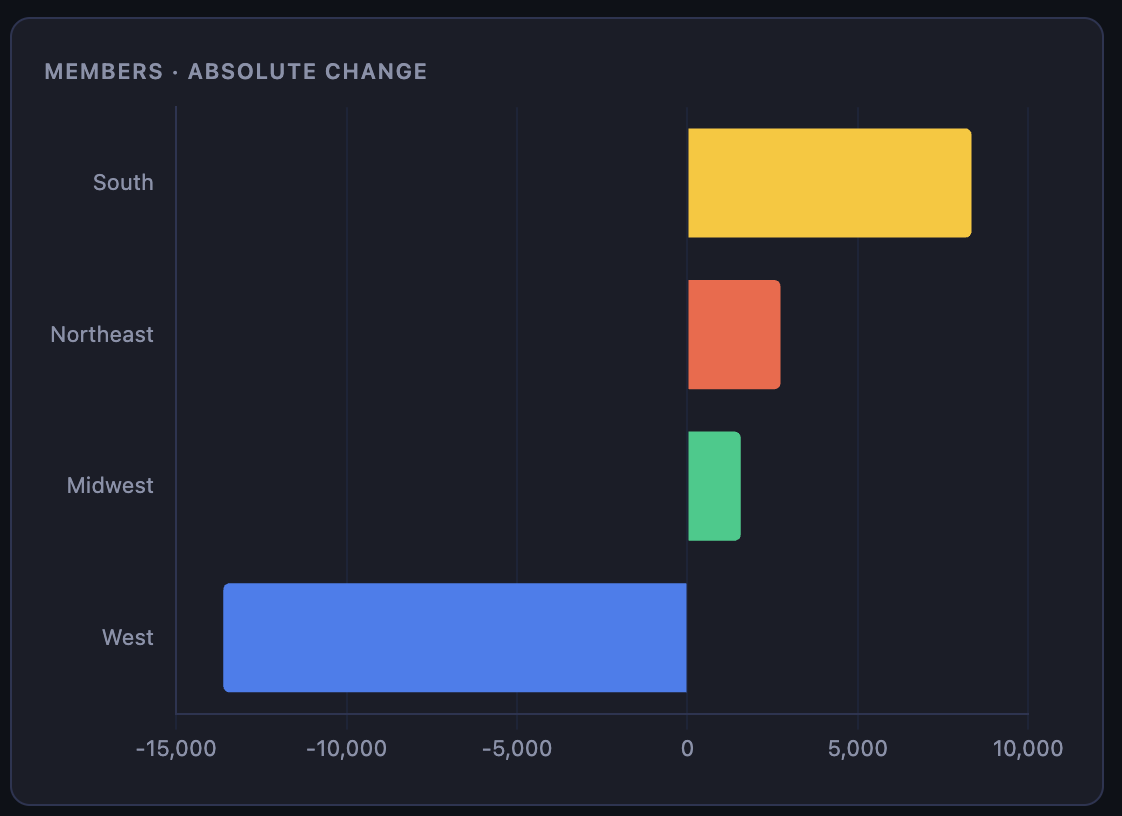
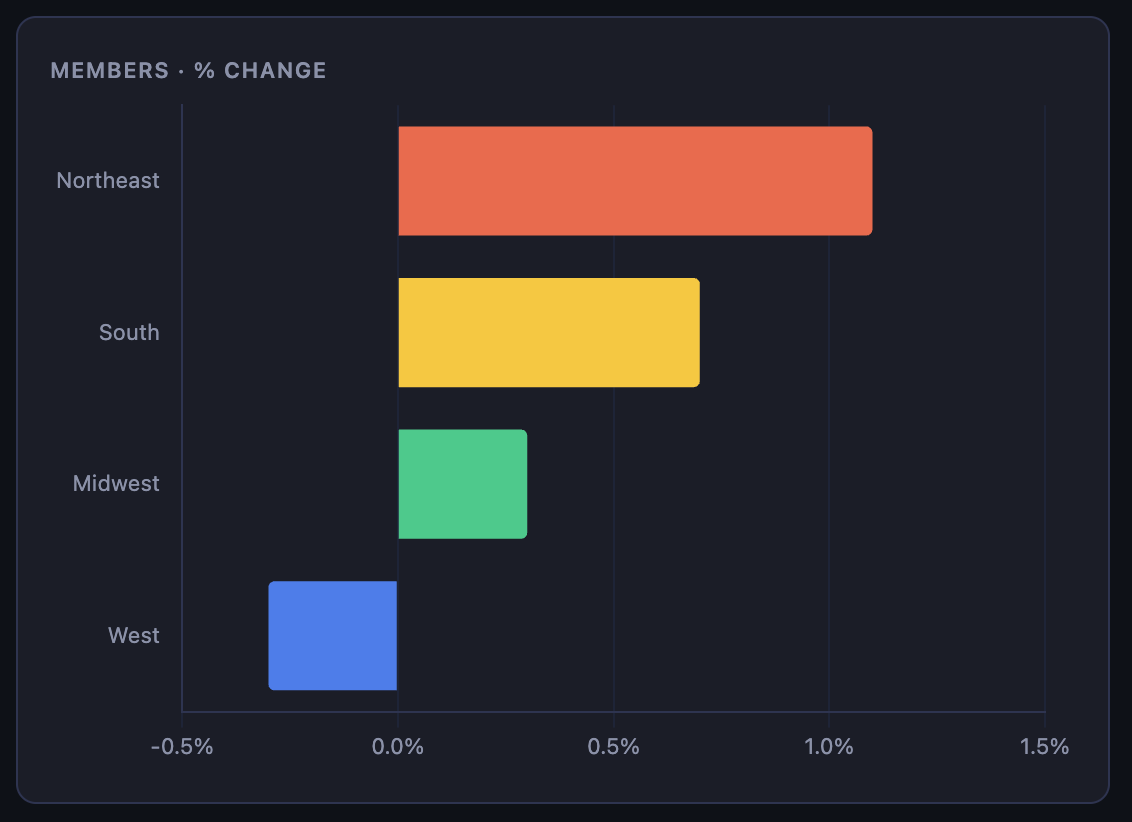
The aggregated numbers are shown above with the west evidently driving the decrease in membership.
In fact, the west is the only region that declined (the other 3 increased!) But, the west has a disproportionate amount of Latter-day Saints which mean declines there have a larger impact on the ecosystem.
Despite Membership Declines in West, Congregations have slightly increased
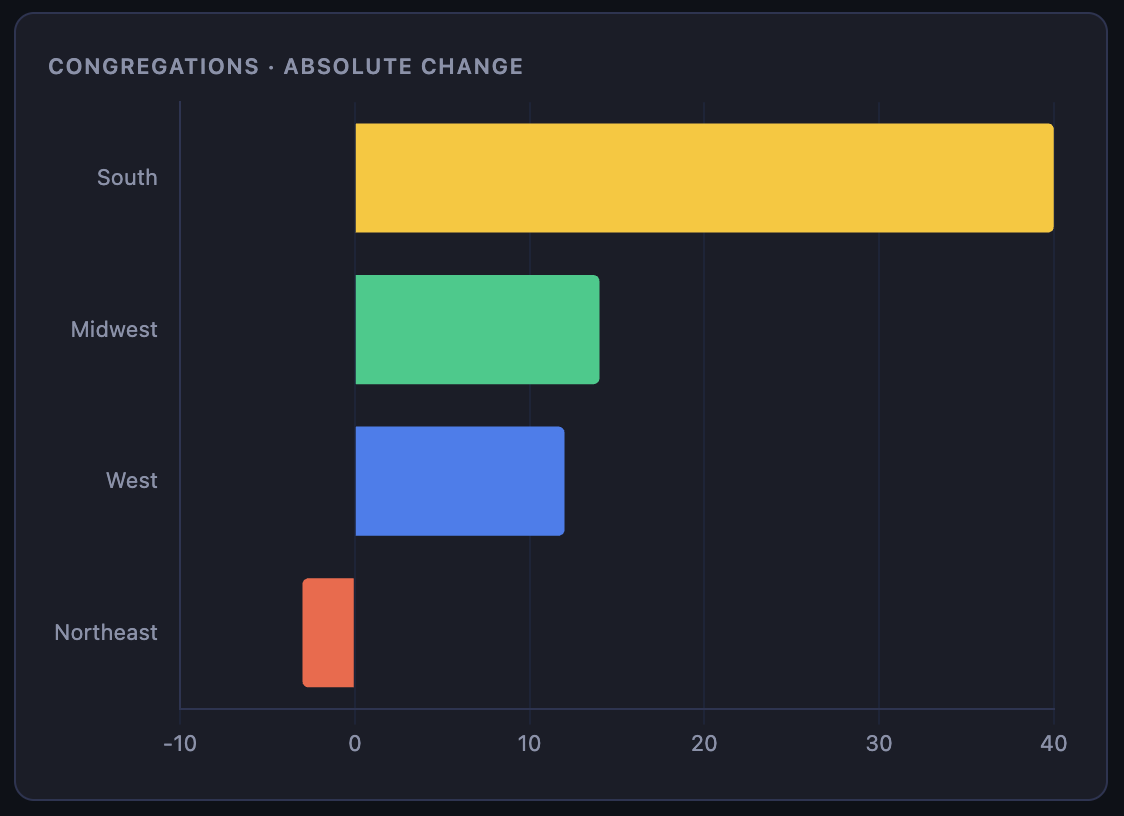
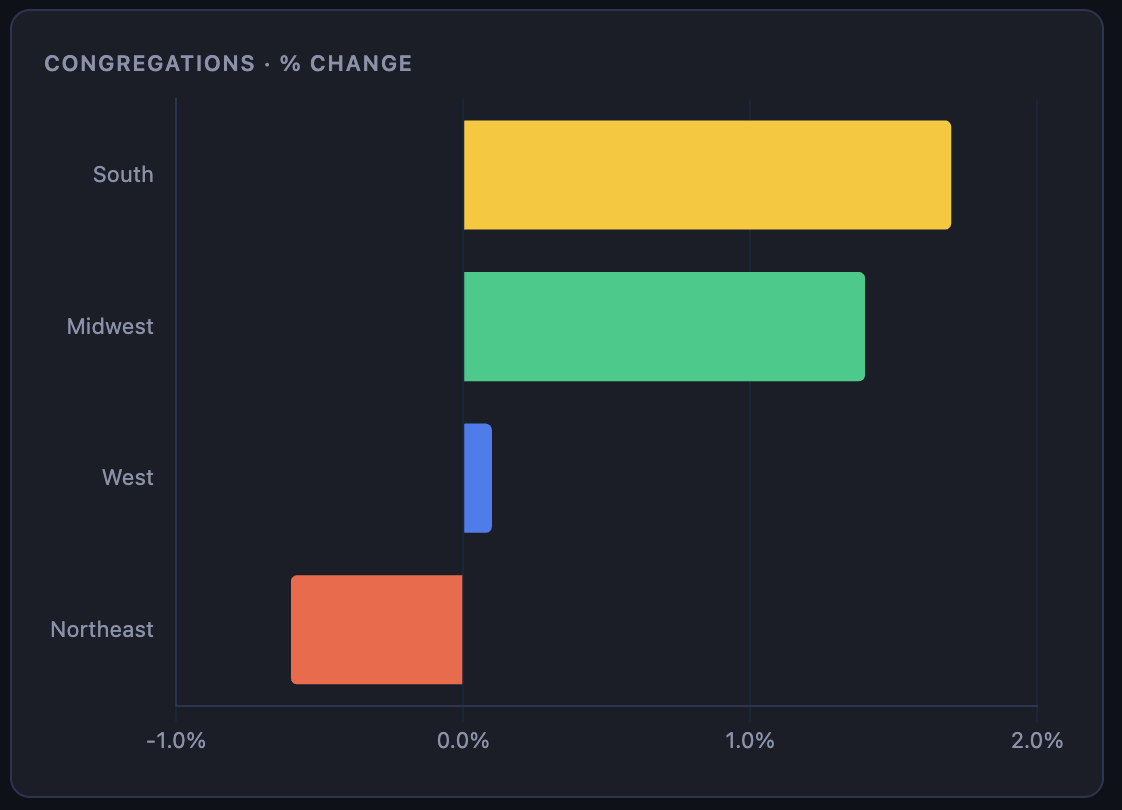
Let’s now look at YoY change in congregations from 2024 to 2025. For this we can see congregations have slightly increased for the West while we see declines in the Northeast.
Congregational decline is often a leading indicator of Membership decline, so this likely means in the next year or two the northeast will decrease in membership.
I also created a chart showing the Year over Year change from 2024 to 2025, so you can find your state.
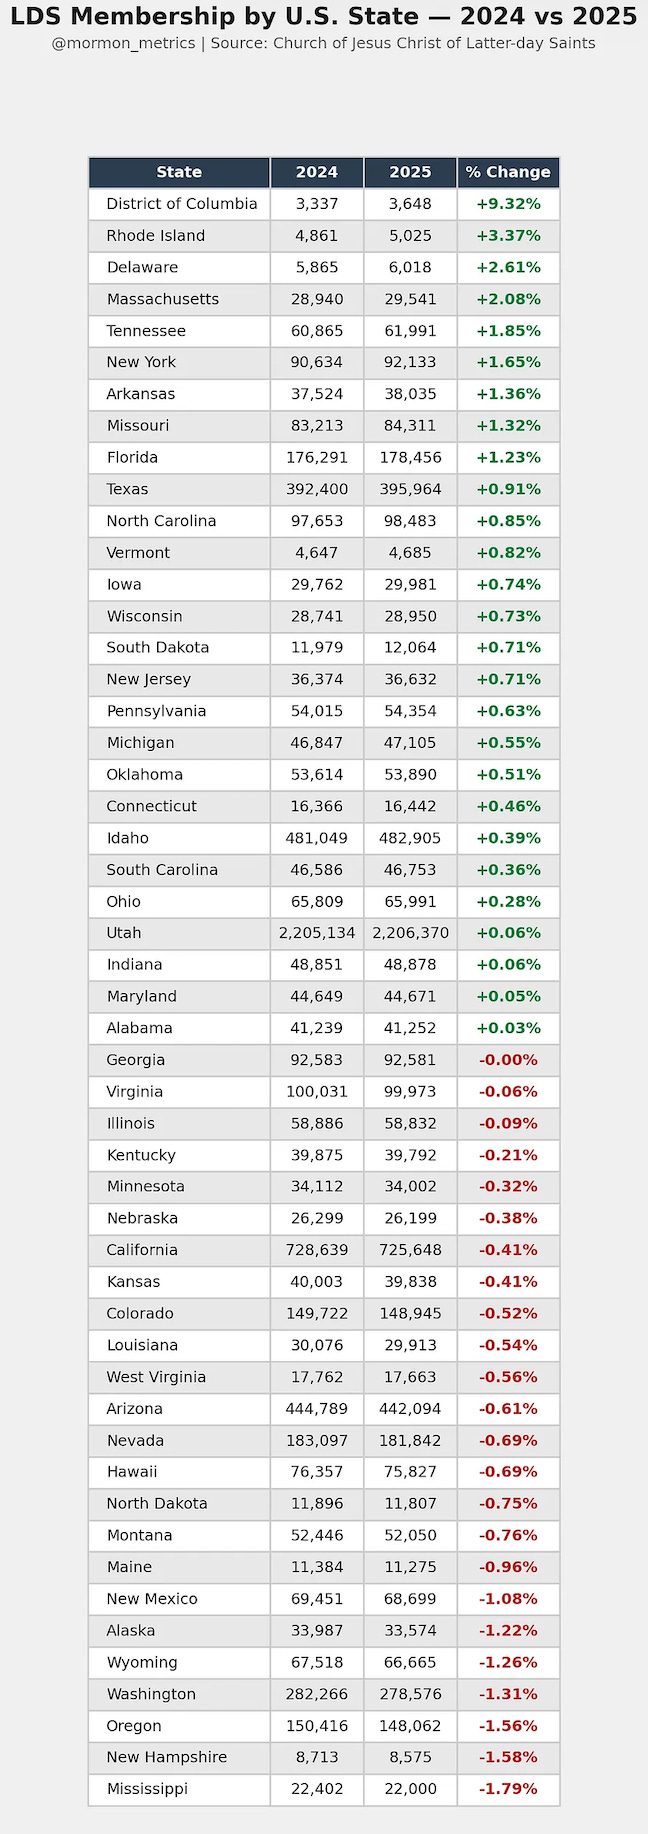
I think there are some counterintuitive numbers on here:
Do you expect DC to increase that much?
What about New York, Massachusetts, or Rhode Island?
Also, might it be time for the rise of Latter-day Saints in the bible belt?
Conclusion
So why did we see membership decreases in the US overall this year?
The western region of the US has seen membership declines especially in Washington, Oregon, and California, but in other western states as well. This drove the overall US number negative despite the other regions actually moderately increasing in membership from 2024 to 2025.
I hypothesize in the coming years we may see a membership decline in the northeast region following congregational patterns.
Did I miss anything? What do you think the future of the Church of Jesus Christ of Latter-day Saints looks like in the US?
This is one of the reasons why congregations is a better metric than membership when understanding church growth. Because there is a minimum required amount of priesthood holders, it is a more time sensitive metric (and we see congregations dip before membership does in these charts!). If there dips below that many priesthood holders, a ward combines. Whereas membership numbers can be bloated with inactive never-returning members that stay on records for years later!
Hey Alex!!! Been too long since we chatted. I have been watching your content for a bit now. I was wondering if you could site your numbers with links if possible. My in laws believe church membership in the US rose by 16% last year but I have been following your statistical posts and think your numbers connect more. I know you say you reference numbers the church shares so I am hoping to get membership numbers from the church to share with them.
Thanks for this excellent analysis! You mention that congregational decline is usually a leading indicator of membership decline which I thought was interesting. Why is that the case? I would have thought the opposite to be true (i.e. membership decline first, and then congregational decline follows).