
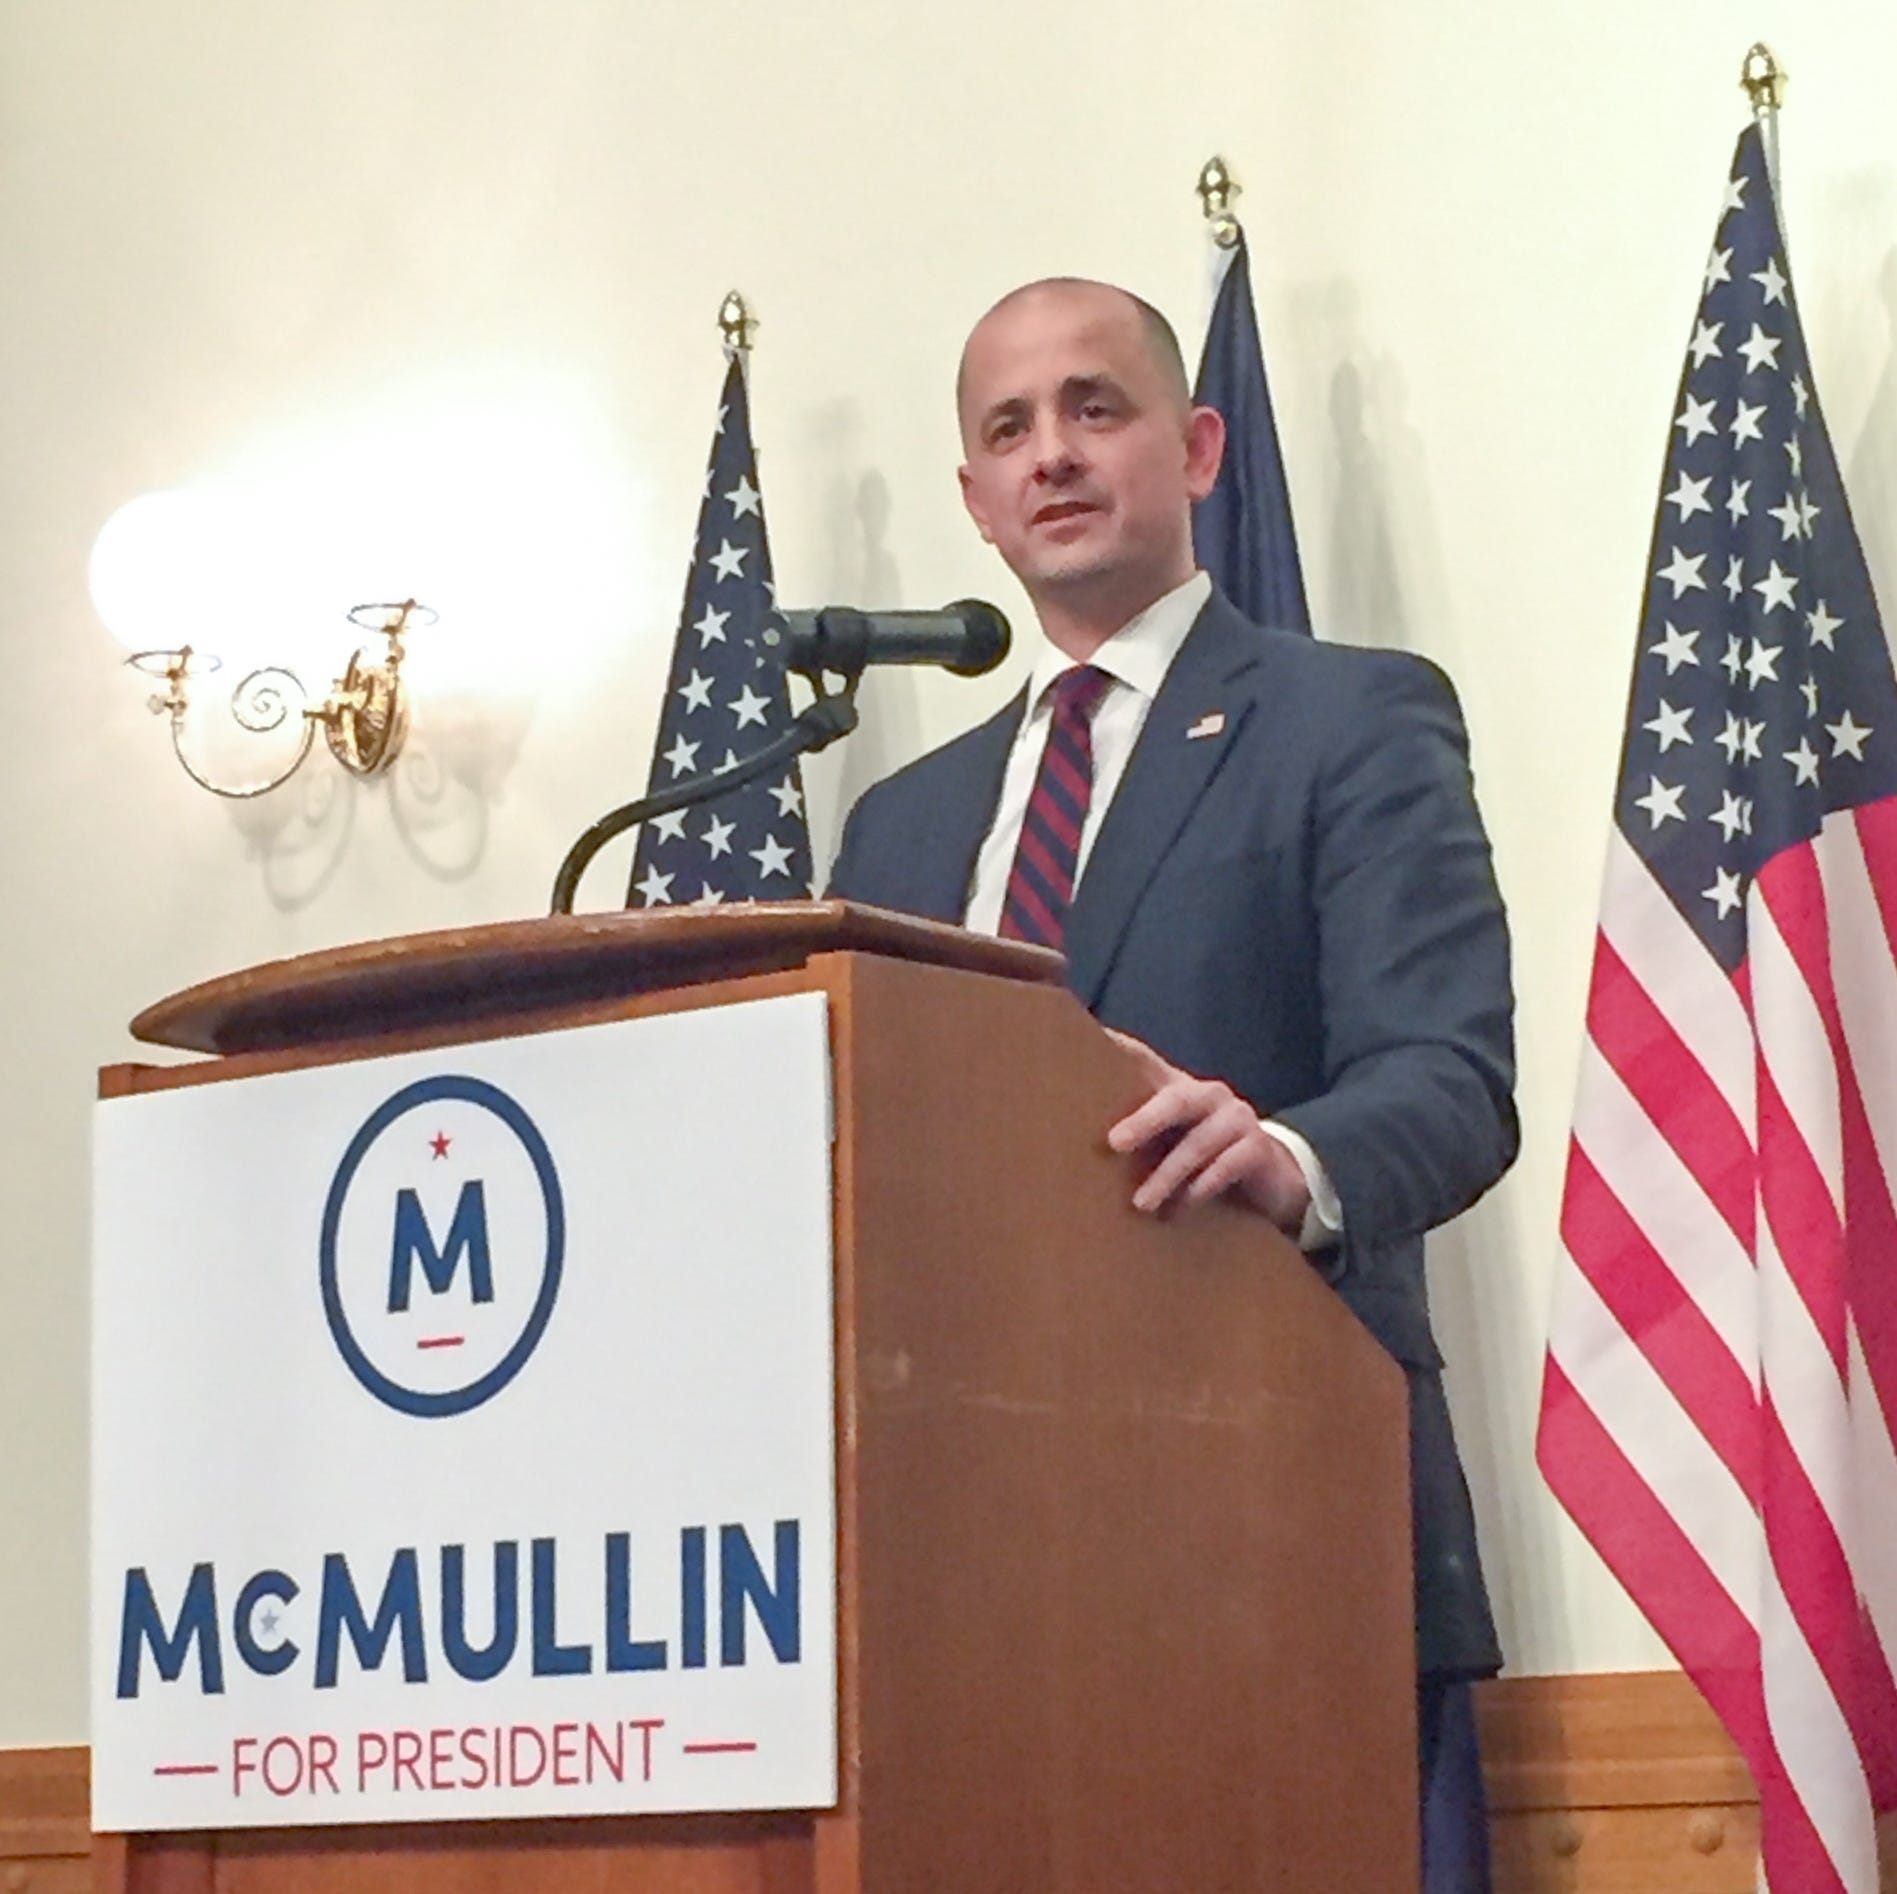
The Evan McMullin to Democrat Pipeline & Other Election Stories
Mormon Voting Trends Last 5 Elections Adding New 2024 Election Data(CES)

Introduction
Not very long ago I wrote about which Mormons are Trumpers and Anti-Trumpers.

Now let’s look at data from the 2024 Cooperative Election Study which was just released earlier this month and see how things have changed the past 5 elections.
I wanted to incorporate some previous feedback in which a follower told me to show the election before Romney to get a better sense of how things have shifted Pre-Romney → Trump since Romney (a Mormon) is a special case in Mormon data. I thought this was great feedback, so I add the 2008 presidential election data today.
For a TLDR, just skip down to the conclusion section.
Charts
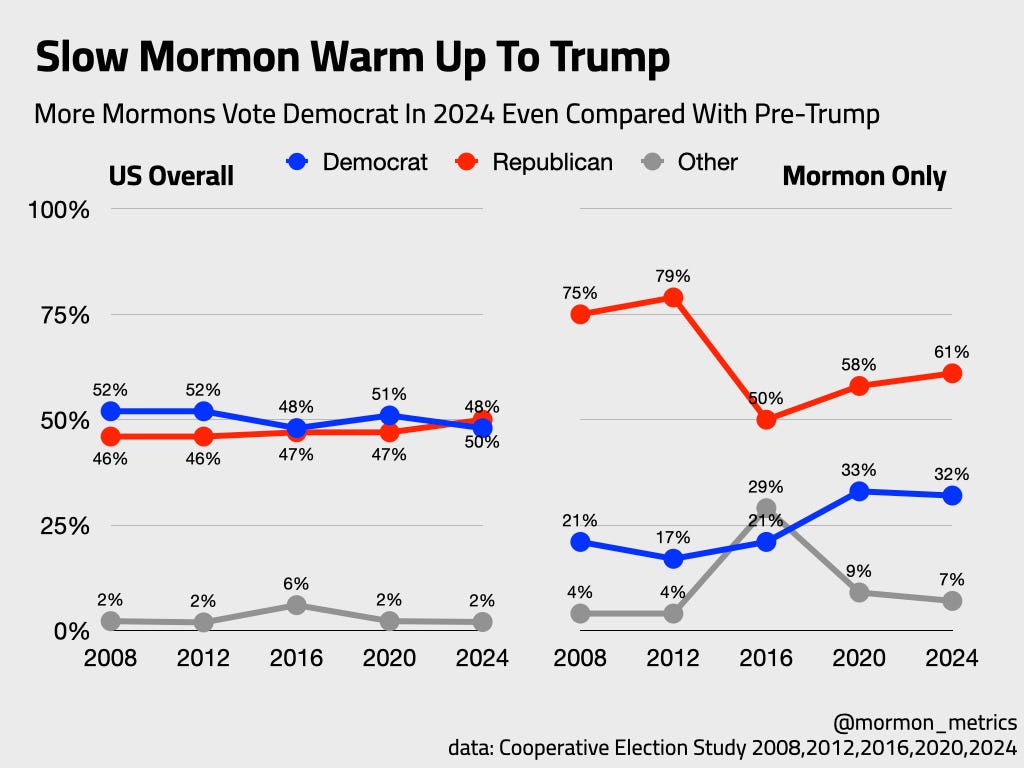
Looking at our first chart, let me point out a few things…
The Mormon vote seems to be slowly warming up to Trump in now the 3rd Trump election (+11 points 2016 → 2024).
Since Trump, Mormons originally spiked on “Other“ candidate McMullin in 2016 and since then the “Other“ vote has stayed higher consistently higher compared to before (4% vs now 9% and 7%).
More Mormons are voting Democrat - even compared to the Pre-Trump era in 2008 Obama v McCain. As you can see from 2008 to 2016, there was a 25 point drop in the Republican vote and only 11 Republican points have recovered since. So with also a 11 point rise in the Mormon Democratic vote since 2008, it is suggestive that many of our 2016 McMullin voters have now joined the Democrats in 2020 and 2024.
For this next part, I looked at 15 or so different demographic questions through the years and took the % that voted for the Republican candidate and subtracted the % that voted for the Democratic candidate by election and plotted it. I show 4 charts with some of the largest demographic differences.
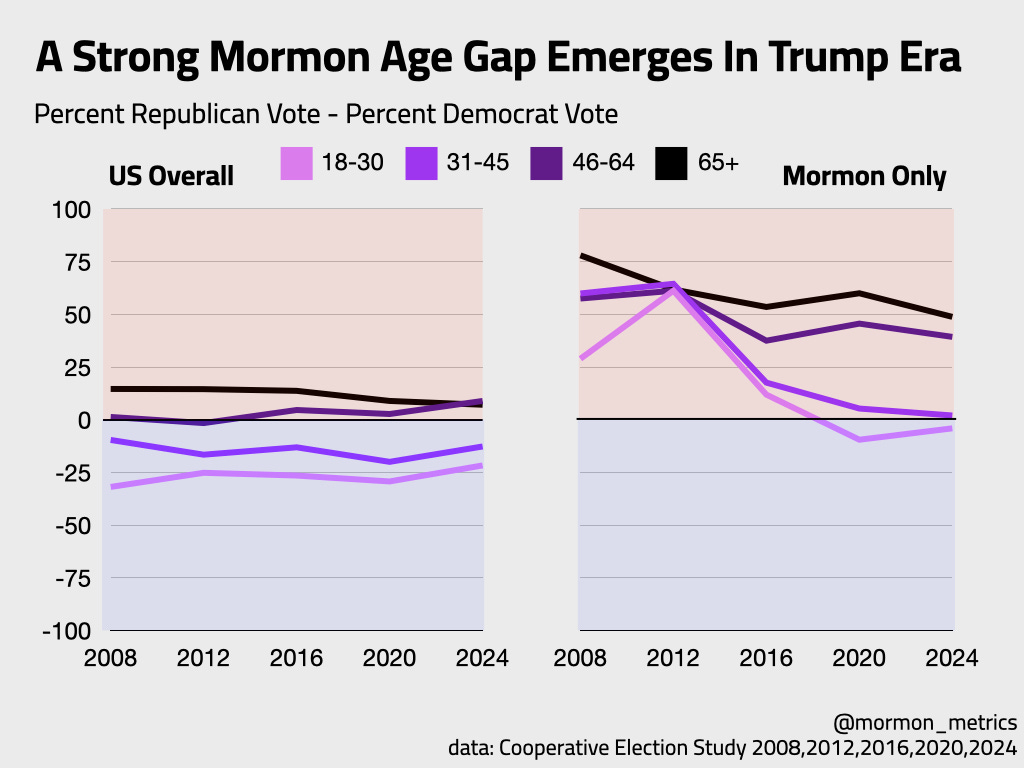
Age has become a large factor in Mormon politics. One interesting thing about the Romney election in 2012 was that he defied the age gap of the Mormon vote. He found strong support across age groups - notably the youngest one 18-30. Since Trump, the Mormon vote age gap has returned and is even more drastic than before and more drastic than the age gap in the US population.
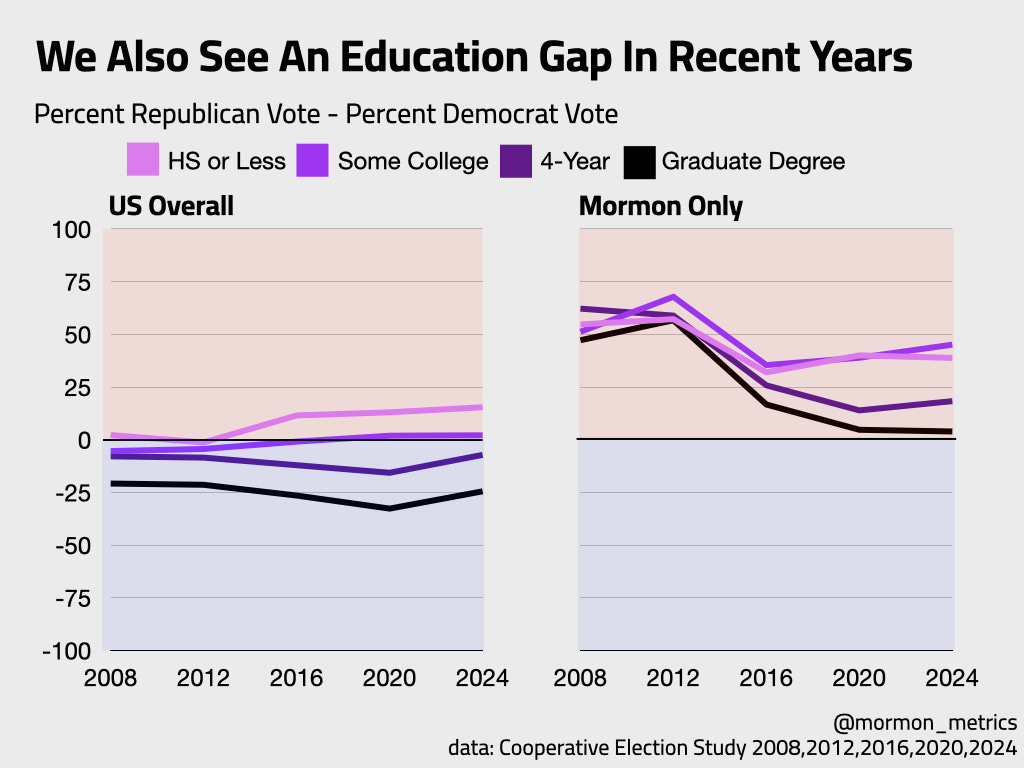
Since Trump, there is also an education gap. In 2008 and 2012, all levels of education in Mormon land voted similarly, but.since Trump a gap has grown. Mormons with post-graduate degrees went from Net +50 Republican vote to just about even Republican and Democrat vote in 2024. 4-Year degree Mormons saw a similar drop. We do not see the same in the US population. We see a similar education gap in the US population as it exists now Mormon population. But, the education gap is new for Mormons.
Also note that in 2016 all education levels decreased together, but in 2020 and 2024 we see continued resistance and further distance from Trump in higher education levels and lower education levels warming up to Trump slightly more.
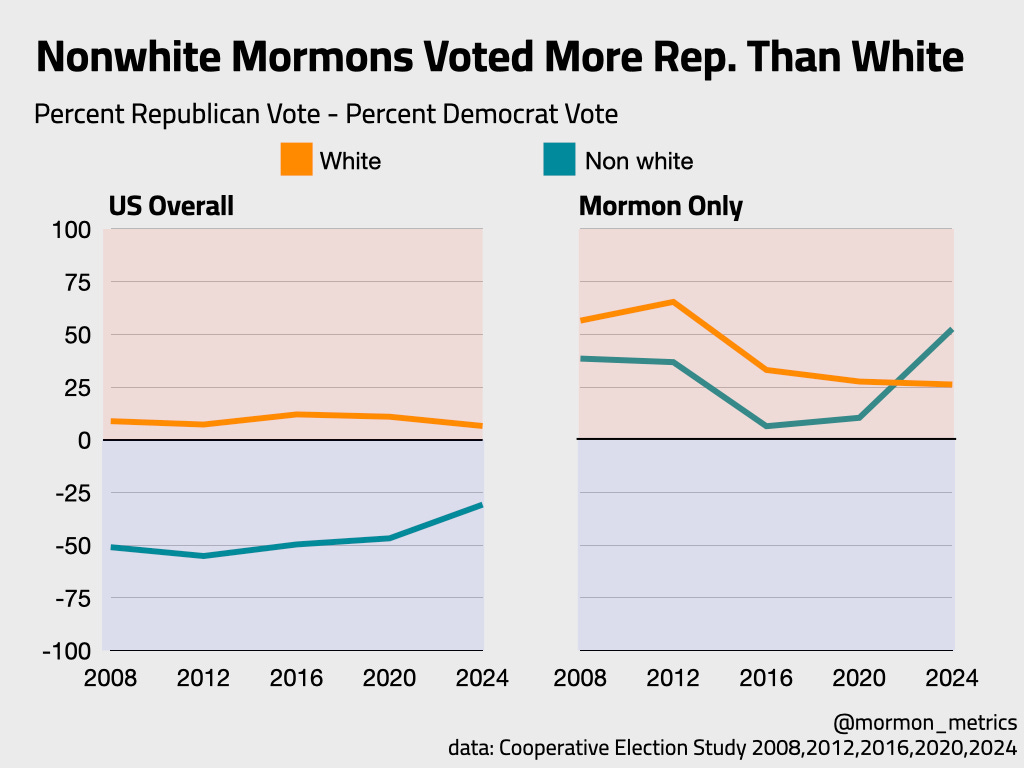
Perhaps one of the most striking findings in the 2024 data to me is the Non white shift.
We’ve heard in the national news that in the general public Nonwhite Americans have shifted to the right - especially Hispanics and Black Americans.
From this data we can see that Mormon Nonwhites have always been more republican than US general population Nonwhites. What’s new is… According to the CES, Non white Mormons were more likely to vote Republican than White Mormons in the most recent election.
Something I want to look into in future posts is finding the most Republican nonwhite groups. I wouldn’t be surprised if Mormons are a top contender for the most Republican nonwhite group if not #1.
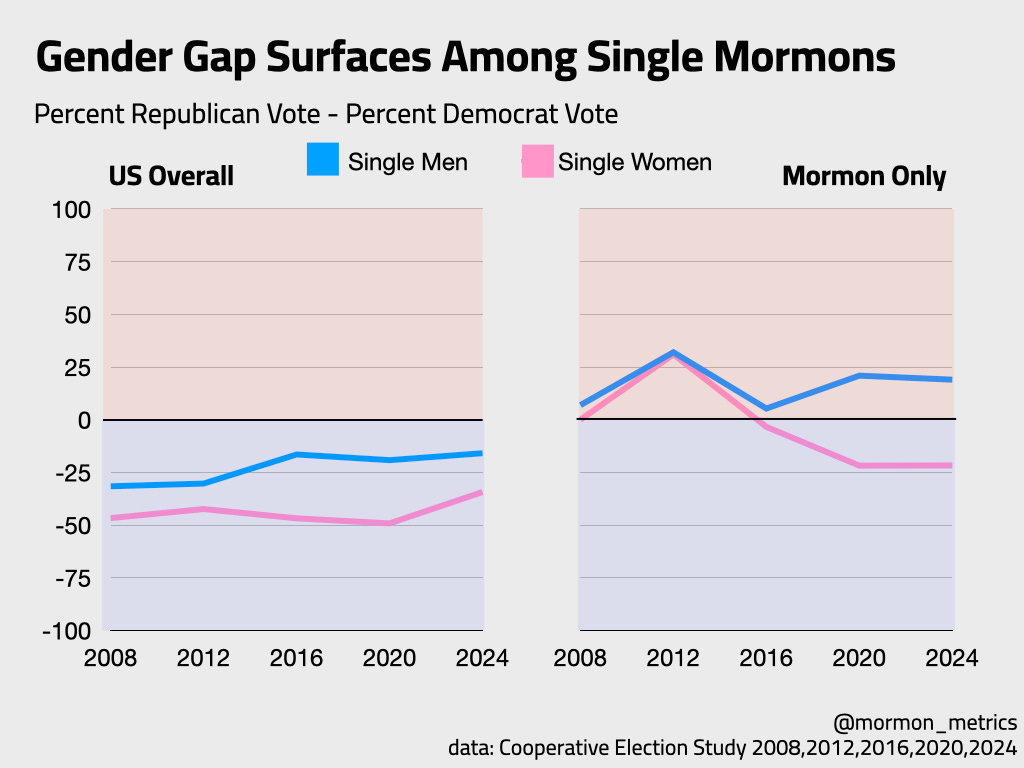
One last Trump era gap, I’ll point out is the Mormon single gender gap. Recently in the US, there has been more of a gender gap among young people in the US. Now we are starting to see it among single, never married Mormons.
A favorite political analyst of mine (and former boss) discovered an interesting insight that also plays out in the Mormon data. In the US many people assume there is a gender gap among young people, there is a gender gap but its actually for single people which skews young. Read more below looking at that in more depth.

Conclusion
So what are the takeaways?
Mormons are warming up to Trump over time though it hasn’t recovered since Pre-Romney.
There are more Democrats since the Pre-Romney which I suggest is part of the McMillan voter to Democrat pipeline.
A few mormon groups have warmed toward Trump since 2016 (Nonwhite, Lower education attainment, older) and a few groups have continued to move away from Trump (younger especially single females, white, higher educational attainment)
What do you think of my post? Any thoughts or feedback? Let me know in the comments and see you next week!
My code is available here and public data file is found here. Also, if anyone is interested in all the demographic scorecard data - essentially how different Mormon demographics voted in the last 5 elections - reply to the email or comment and I’ll send you the full scorecard (excel spreadsheet).