
Economically, How Do The LDS Enclaves Rank?
Part 5 of the LDS Enclave Analysis: Mormon Macroeconomics


This week is the final post in the LDS Enclave series, we zoom out from household measures and local trends to take a macroeconomic view. Using county-level GDP data from the U.S. Bureau of Economic Analysis and comparing it with World Bank national GDP figures, we can see how LDS enclaves stack up — both against other American community types and against entire countries.
Let’s look at a few charts…
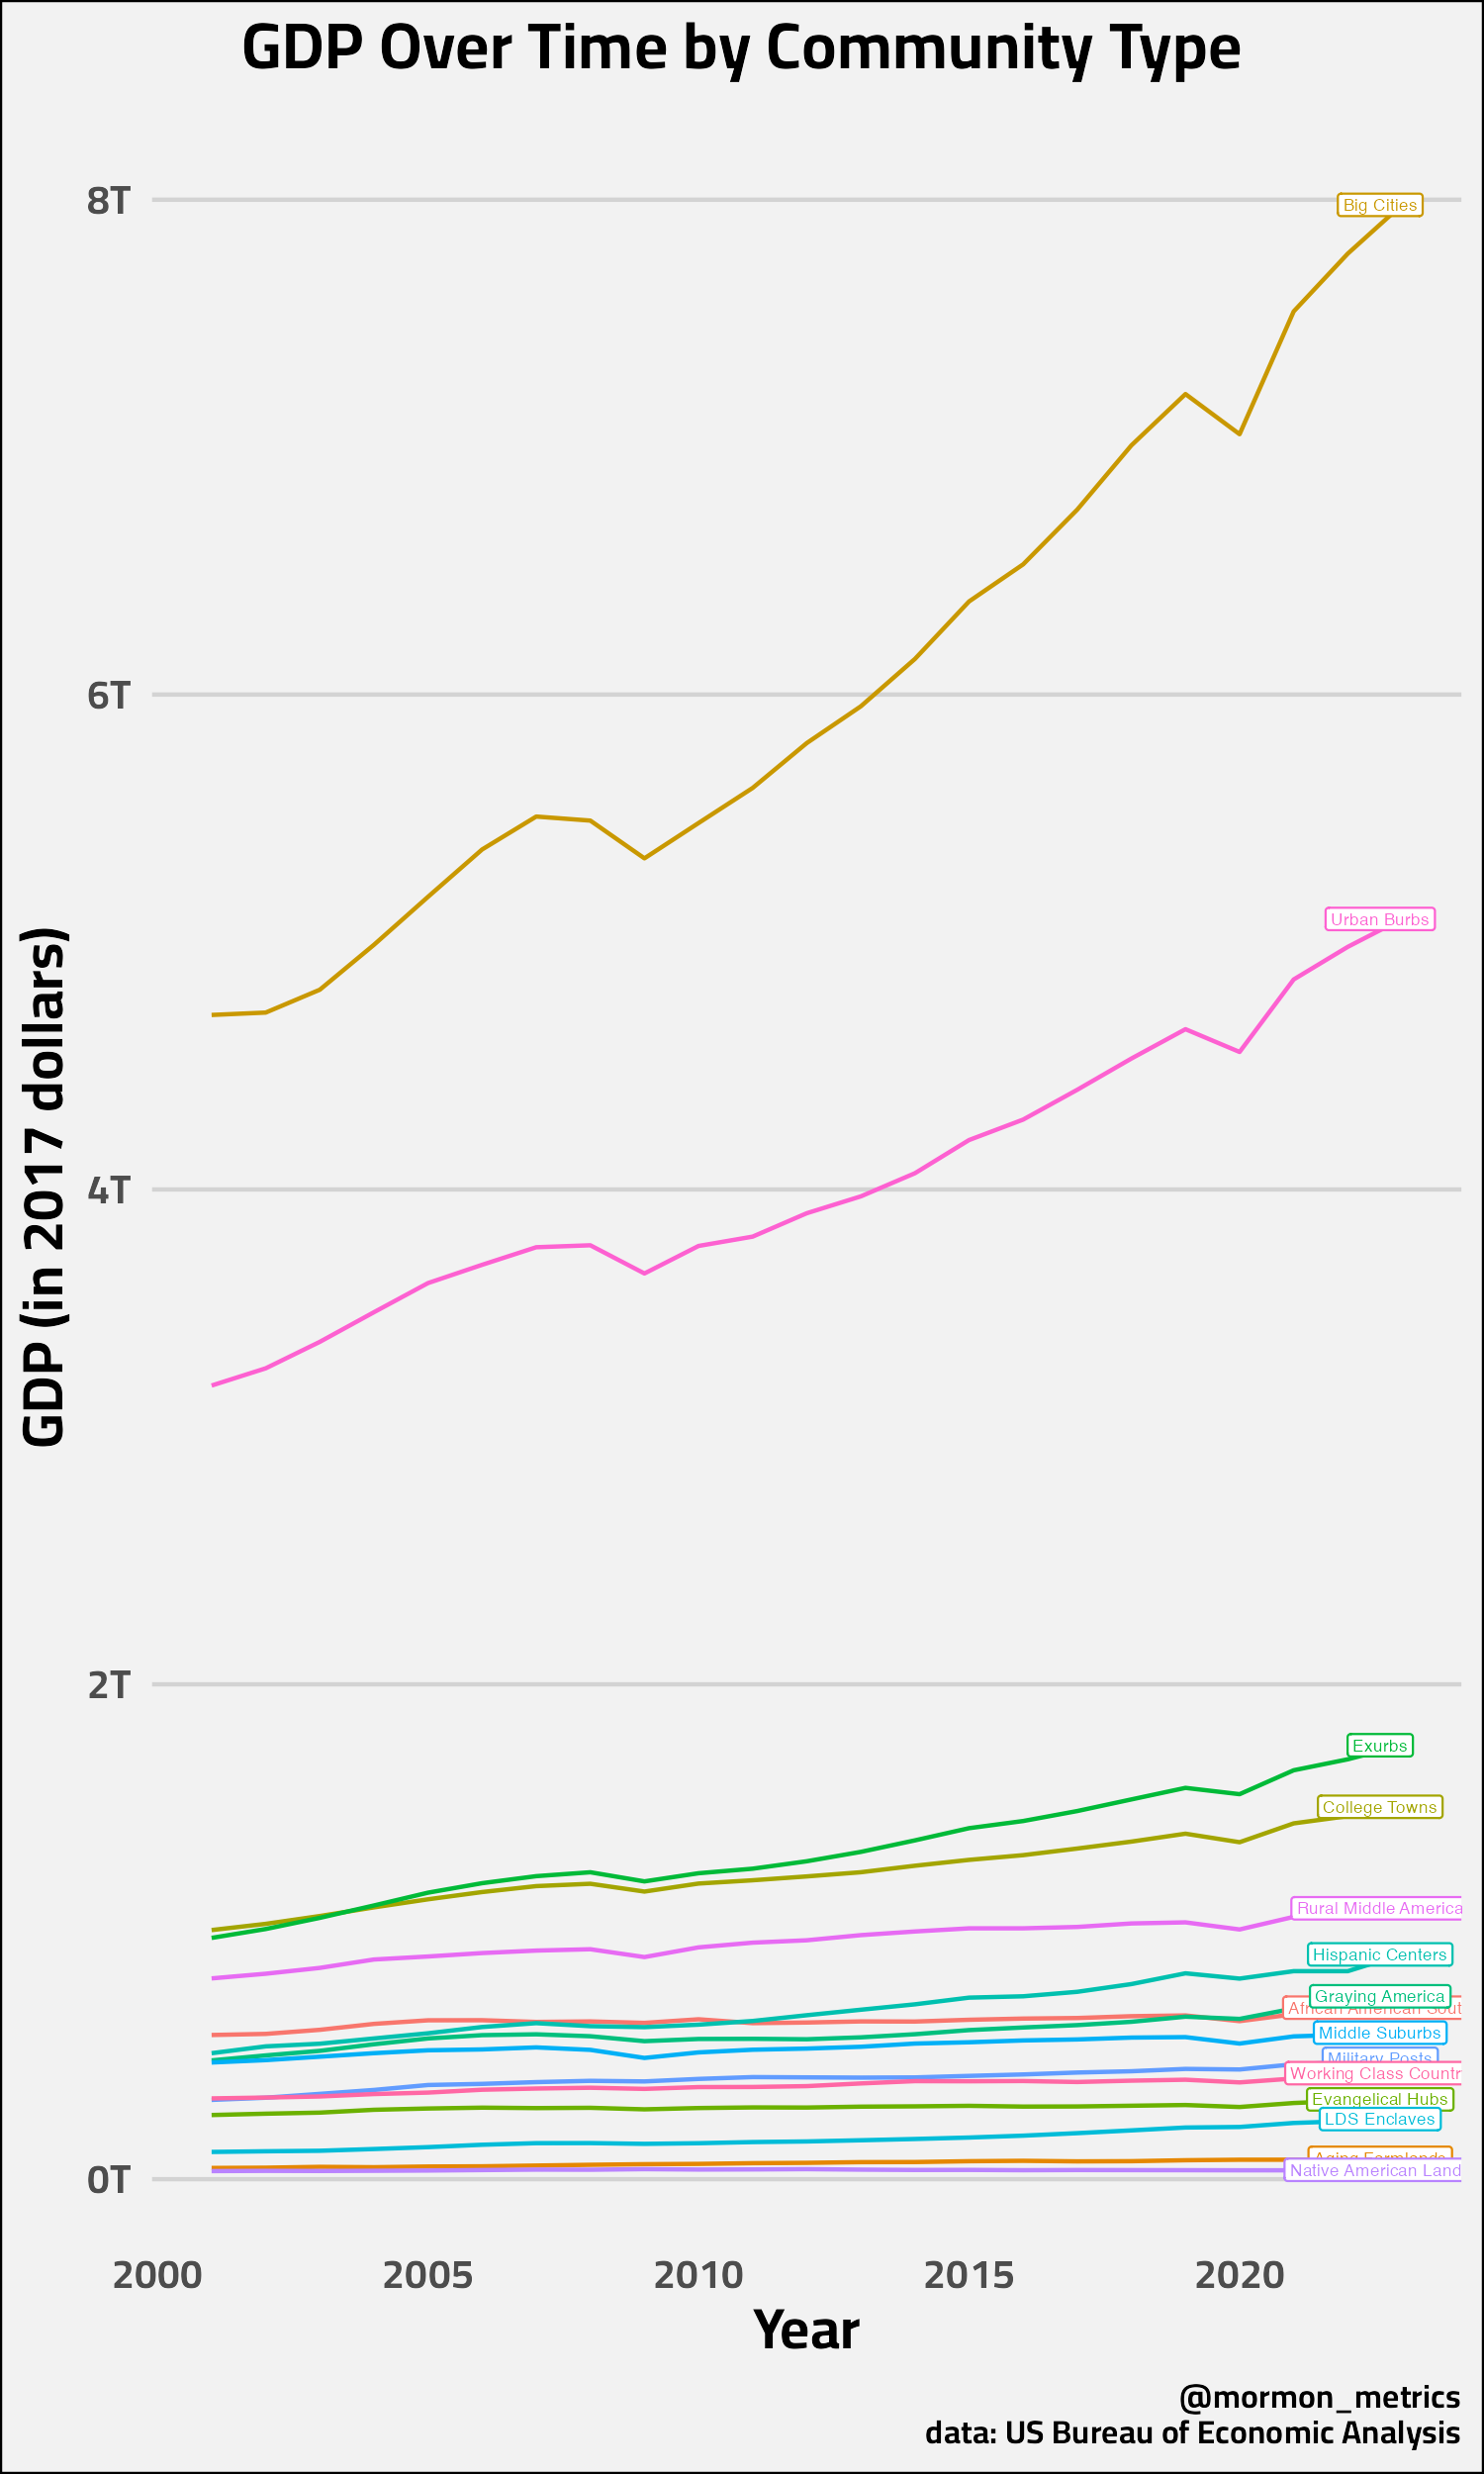
1. Big Cities Dominate GDP… LDS Enclaves Have Steady Growth
Looking first at total GDP, the largest American metros — “Big Cities” in the American Communities Project typology — unsurprisingly top the charts, with economic output approaching $8 trillion in 2017 dollars. Urban suburbs follow, with a mix of professional services, tech hubs, and dense population fueling growth. LDS enclaves are much smaller in total output but maintain steady, consistent growth over the past two decades.
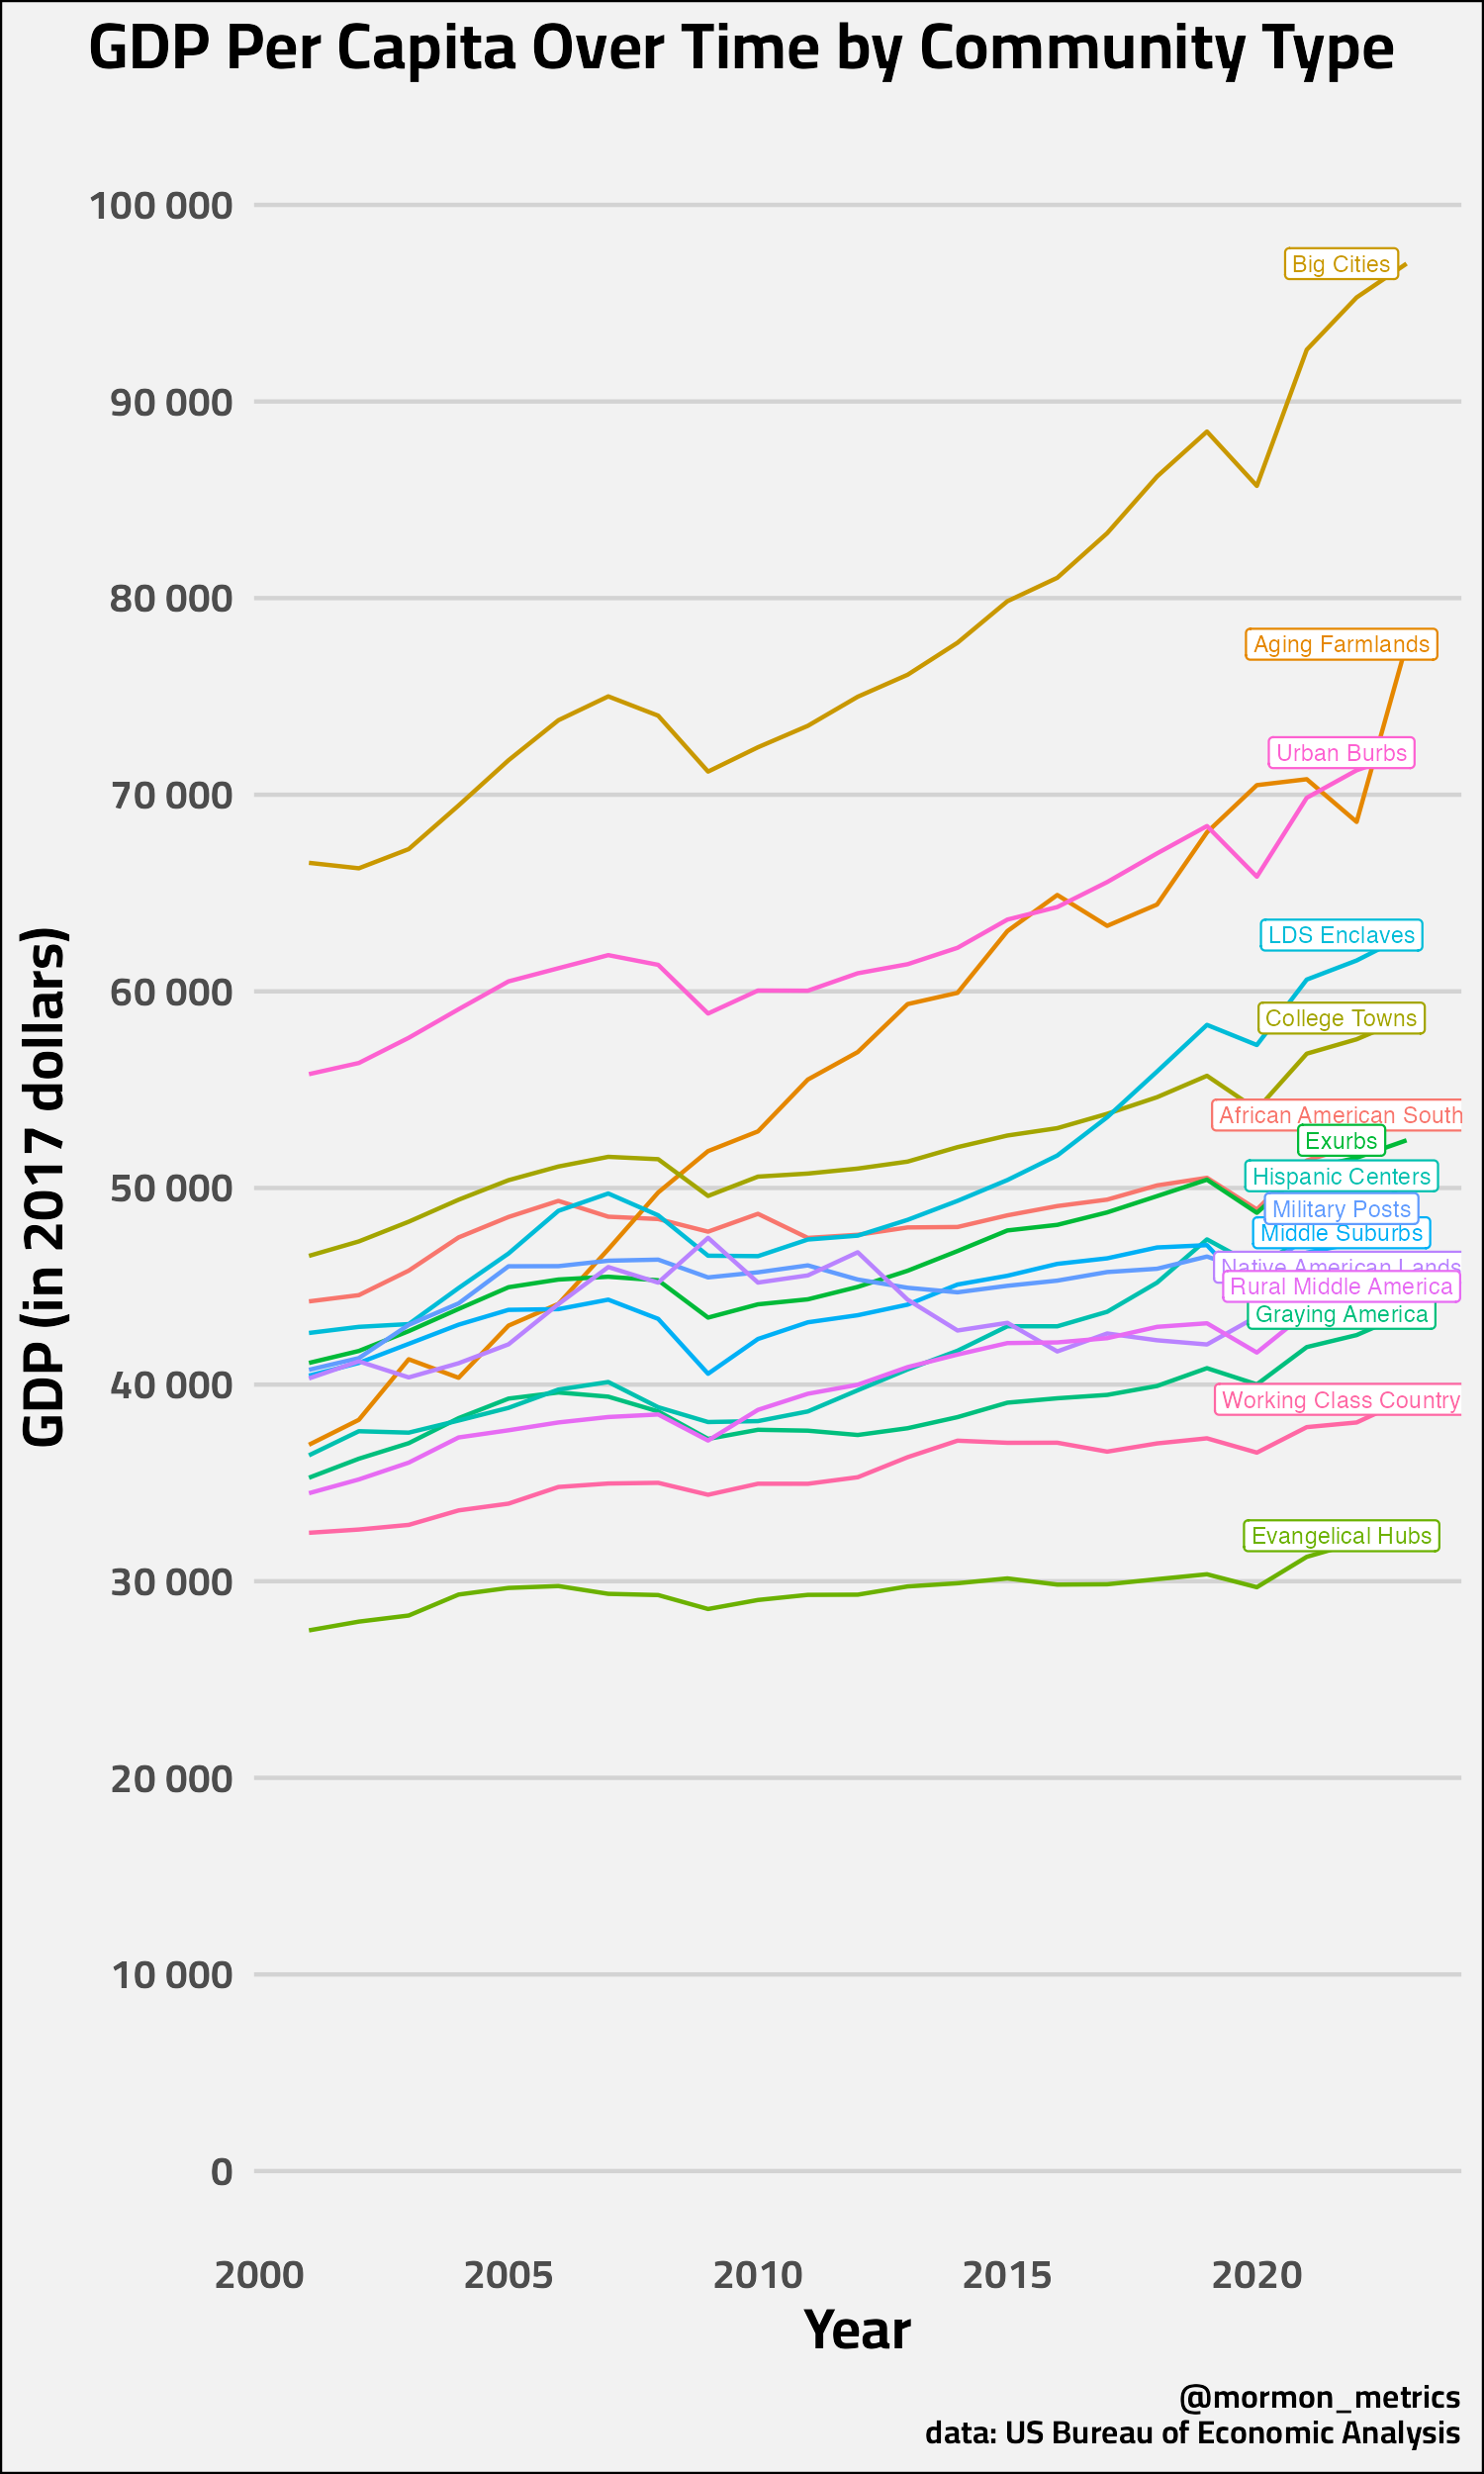
2. Per Capita GDP Shows a Different Story
When we shift to GDP per capita, LDS enclaves rise in the rankings. In 2023, residents of LDS enclaves produced about $62,862 (in 2017 dollars) each, placing them ahead of most community types, including exurbs, Hispanic centers, and military posts. They remain behind high-density, high-income communities like big cities and aging farmlands — but far above the lowest-income rural and working-class areas.
Also, note that the GDP per capita difference between LDS Enclave is almost double that of evangelical hubs representing yet another overperformance. I wrote about this in a previous part in this series as well:

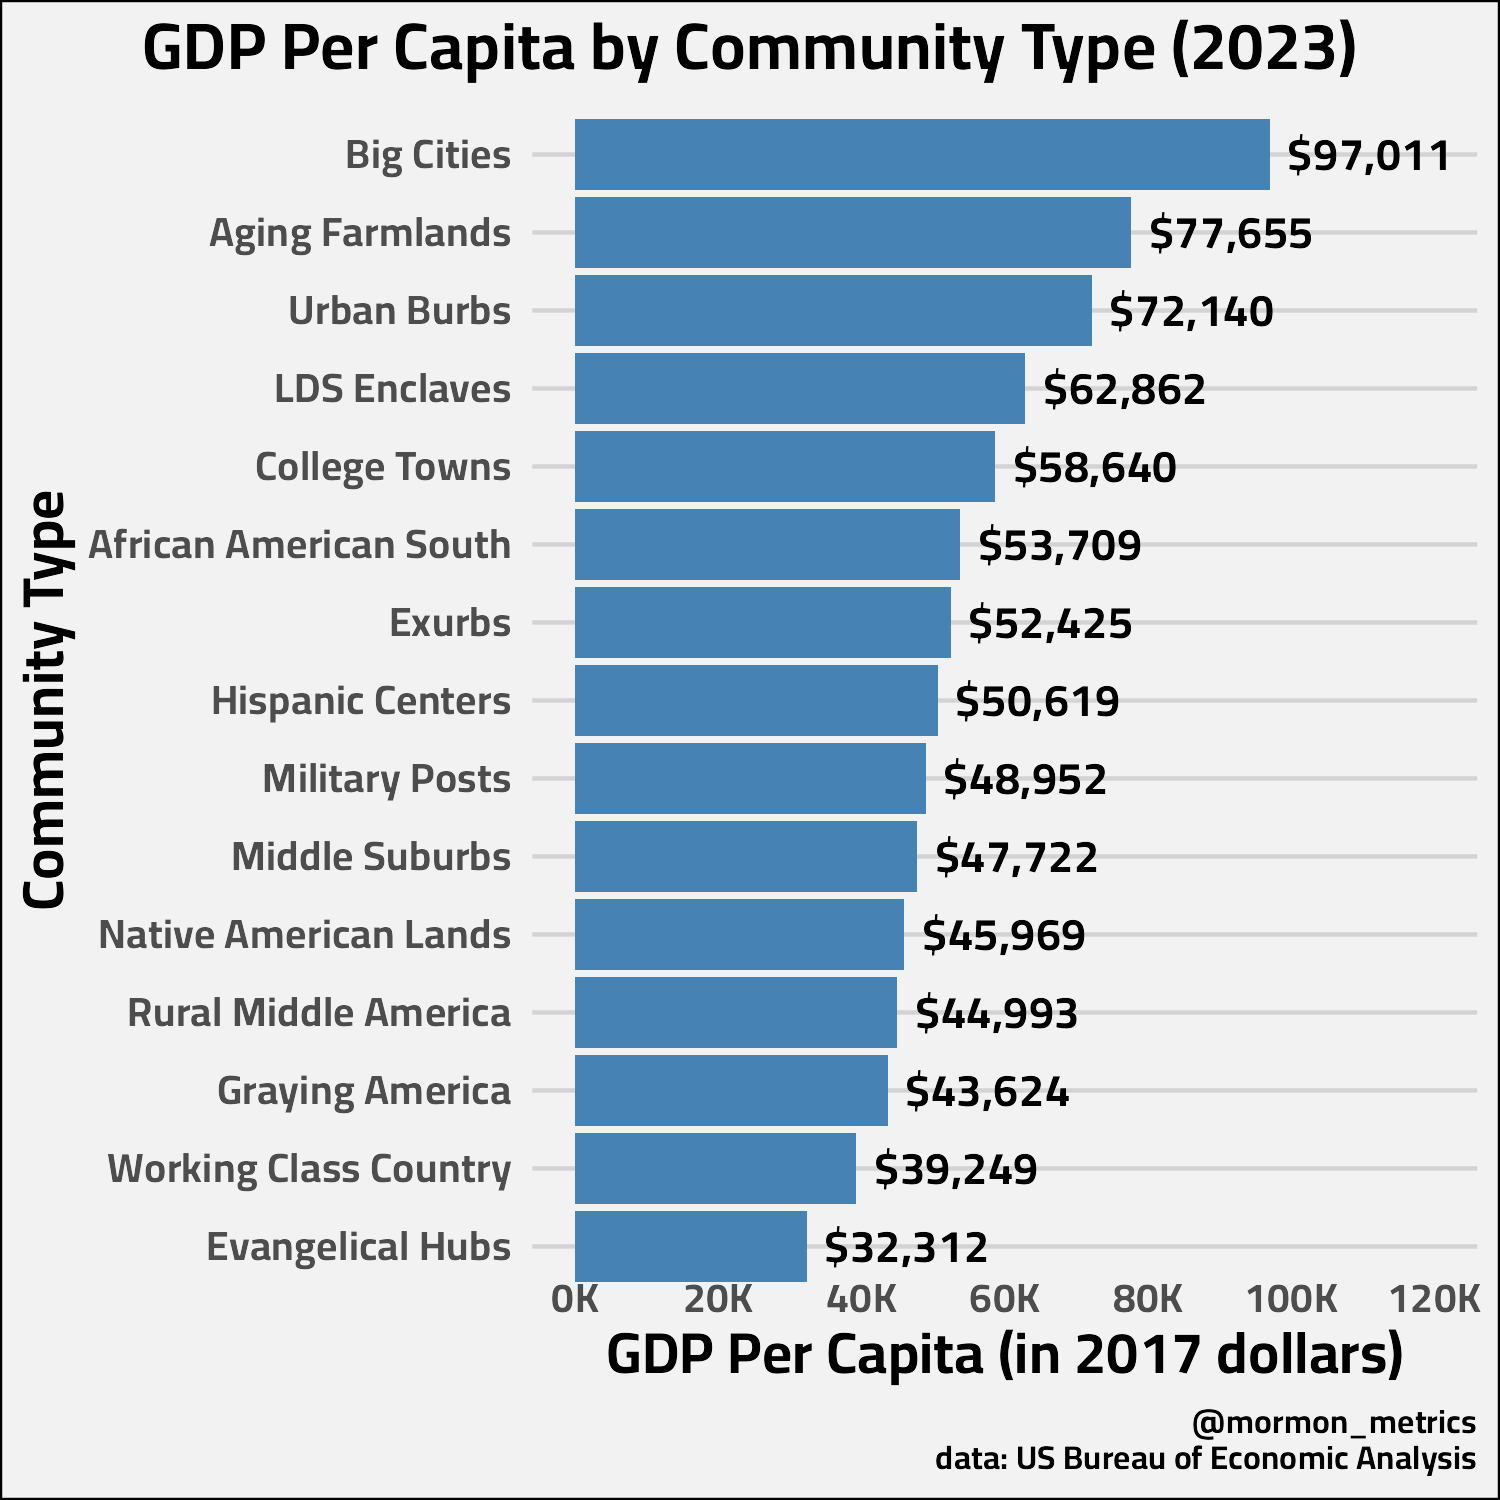
3. The 2023 Per Capita Snapshot
The latest snapshot reinforces the point: big cities lead at nearly $97k per person, aging farmlands sit around $78k, and urban burbs at $72k. LDS enclaves claim the #4 spot nationally by community type, illustrating their relatively strong productivity compared to their size and geography.
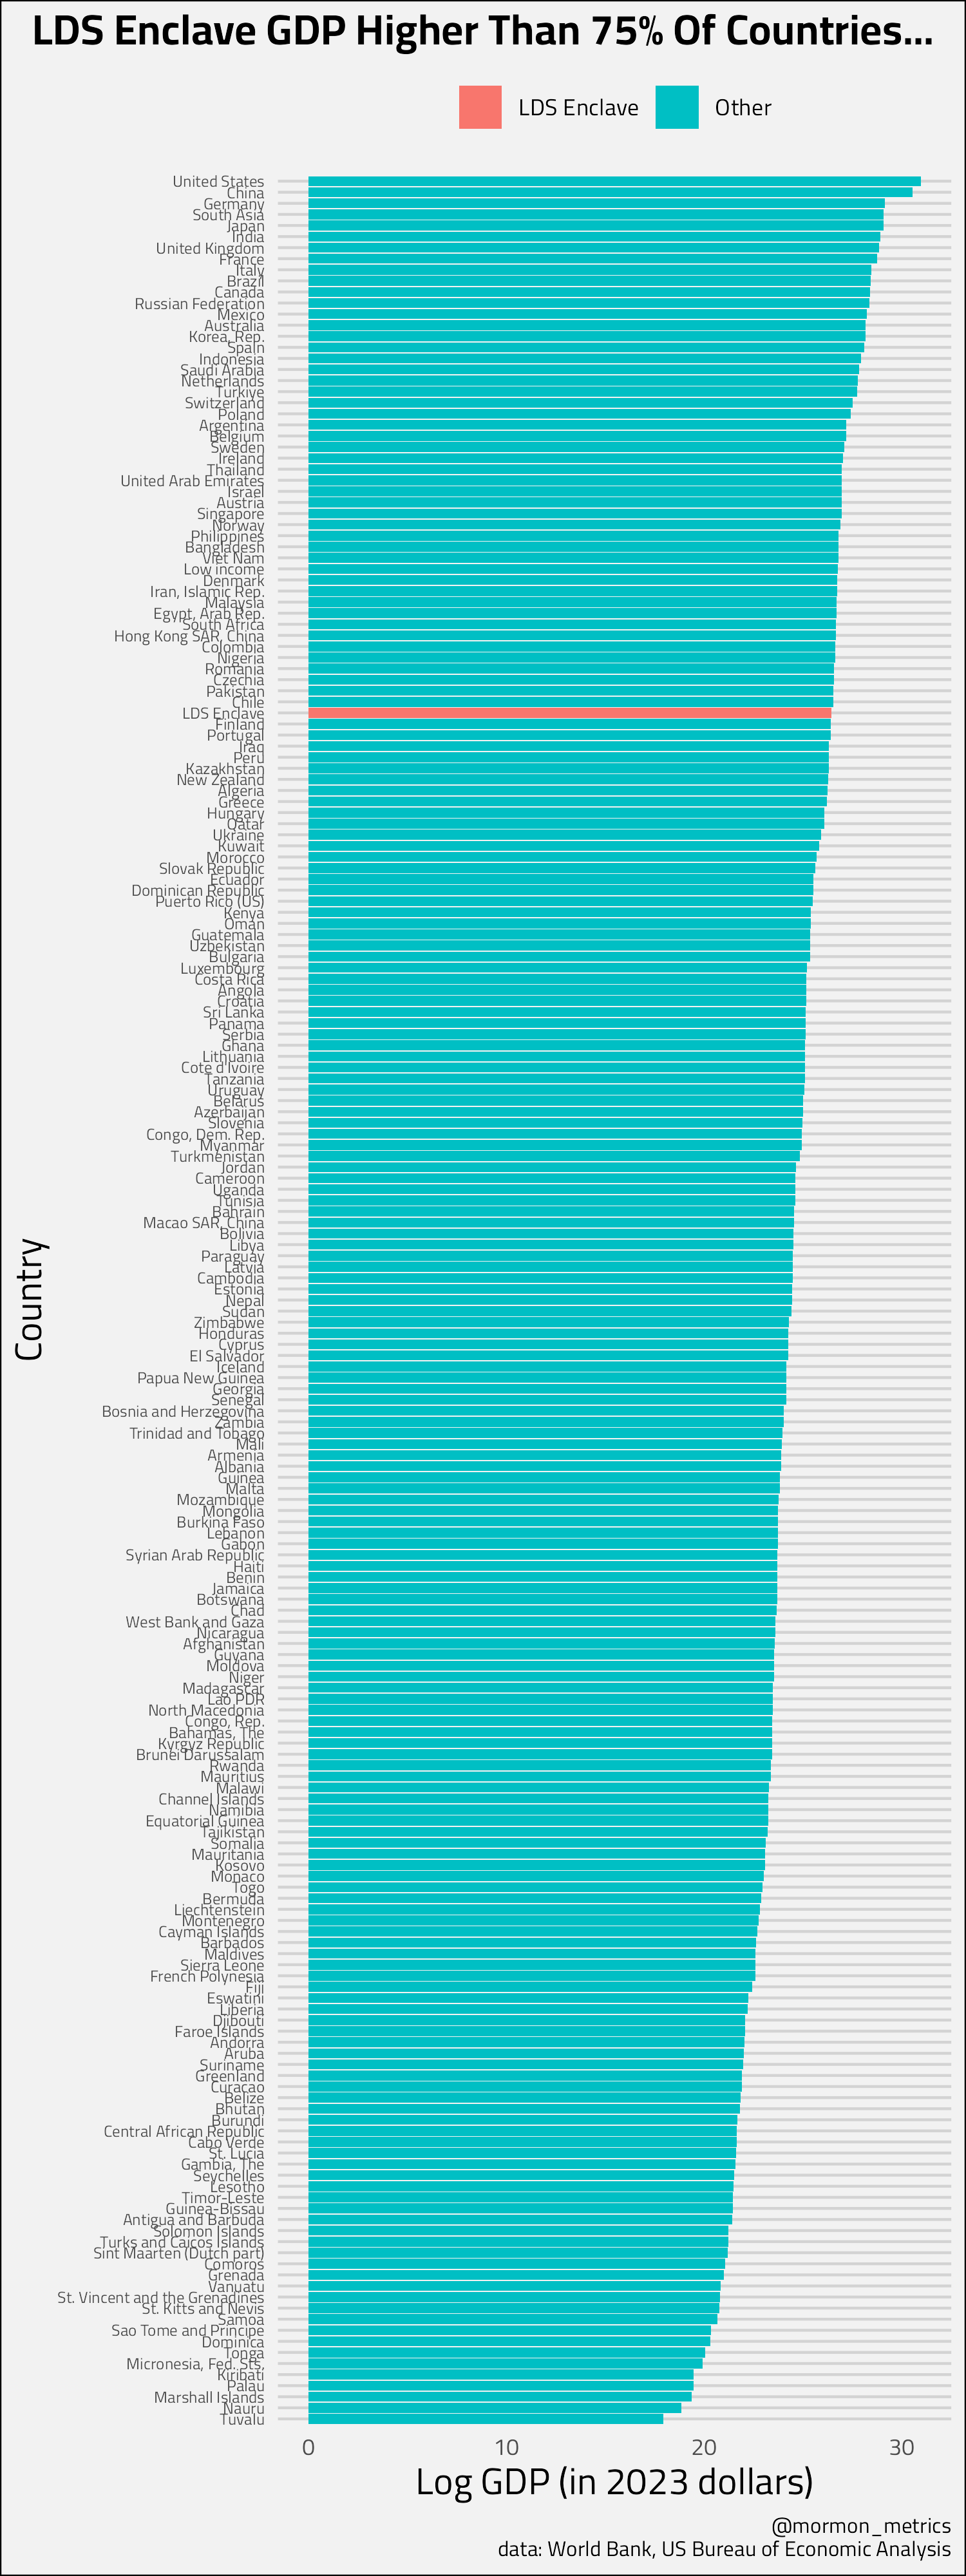
4. LDS Enclaves Outperform Most Countries
Placed in an international context, LDS enclaves look even stronger. In total GDP, they outrank about 75% of all countries — sitting above Chile, Portugal, and New Zealand in sheer economic size. That’s remarkable given they represent only a slice of the U.S. population concentrated in the Intermountain West.
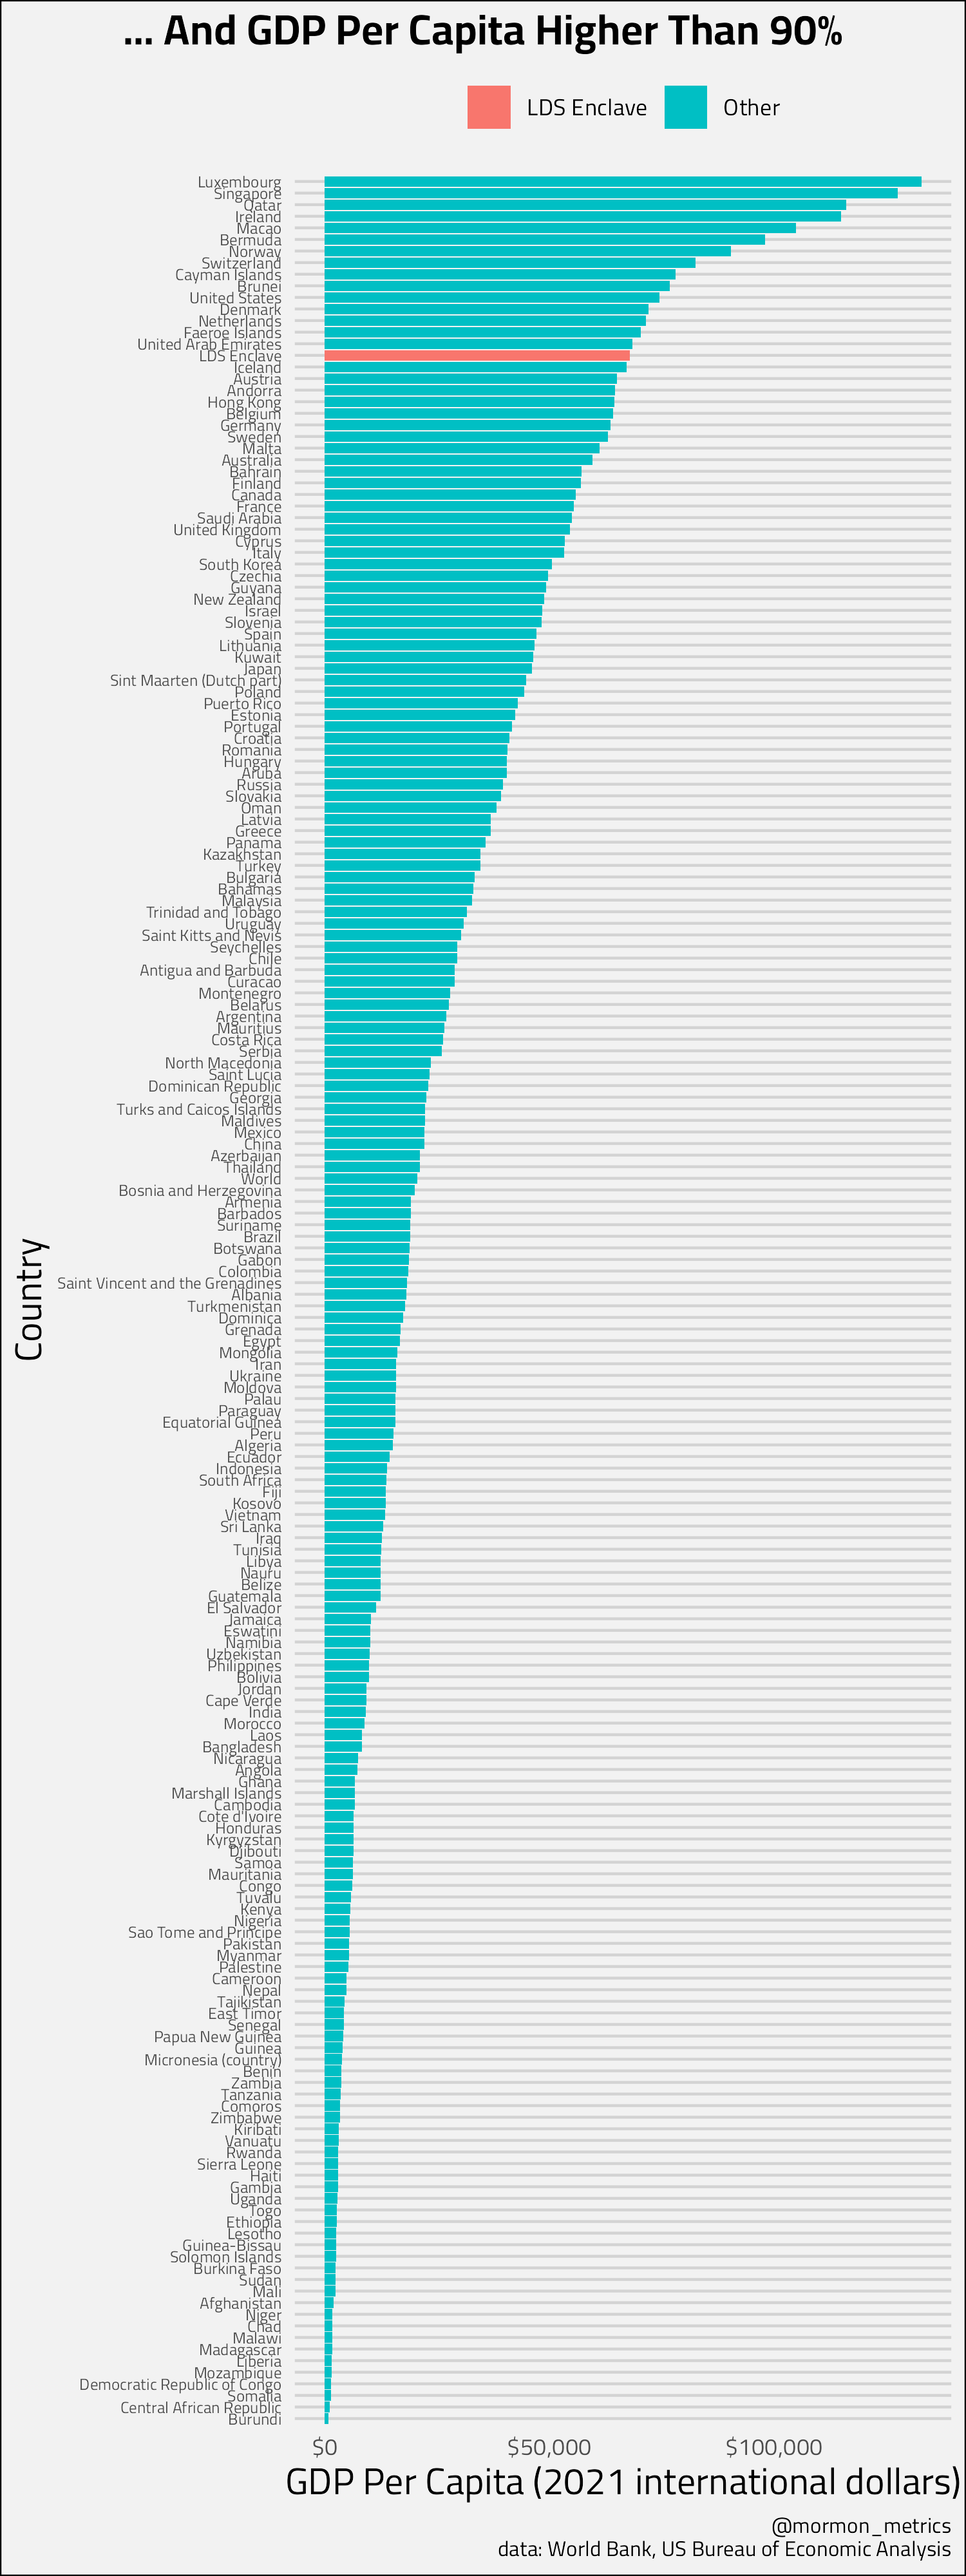
5. And Their Per Capita GDP is in the Global Top 10%
In GDP per capita, LDS enclaves fall into the global top decile — comparable to advanced economies like the Netherlands and United Arab Emirates, and ahead of countries such as Japan, South Korea, and the UK. For a region often associated with rural and small-city living, that’s a testament to its economic mix of tech, manufacturing, and resource industries.
Takeaways
LDS enclaves punch above their weight in both national and global comparisons.
They rank 4th among U.S. community types in per capita output.
Internationally, they sit in the top 10% for GDP per capita and above most countries for total GDP.
Economic strength isn’t the only story in these regions — cultural, demographic, and religious patterns make them unique. But from a purely macroeconomic perspective, LDS enclaves are far from being on the margins — they’re in the global big leagues.
Thanks for reading the 5 part series.
Next week, we’ll switch to another topic… how did the 2 hour church policy change affect religiosity?
Code and data for this post available here.
.
My takeaway is very New Testament / Book of Mormon: we have way too much money not to be giving it all away.