
Introducing the American Religion Polling Aggregator (ARPA)... And What’s Next
My work over the last several months revealed(!)

Introduction
Writing Mormon Metrics the last two years, I’ve learned about survey data sources and done hard work of cleaning the data, understanding different questionnaires and survey methodologies, and visualizing it for all of you.
One pain point I continually run into (and is prevalent in local and national journalism today) is the “weird survey” phenomenon. Ok, you find something interesting: “X survey says that more than half of all people prefer pineapple on their pizza.” That’s interesting and you see a news article written up about it, but in the next survey or the next 5 surveys, that isn’t true. That survey could have just been a “weird survey” that didn’t represent the underlying population.
The idea is… even employing the most rigorous methods and drawing a truly random sample with the potential to reach everyone in your population, you are going to have some weird surveys with results that don’t represent the underlying population.
This problem compounds in the modern era where biases exist by different survey modes (telephone, web, text, face-to-face), house effects, and using probability vs non probability samples. And then, problems multiply when studying groups like Mormons, Jews, or other small groups. Sample sizes are small so variance increases opening the door to even more “weird surveys.”
To solve this, I built a system designed to look past the noise of any single survey and reveal the true underlying trend: the American Religion Polling Aggregator (ARPA).
Starting today, the core interactive dashboard is live for public use.
What is ARPA?
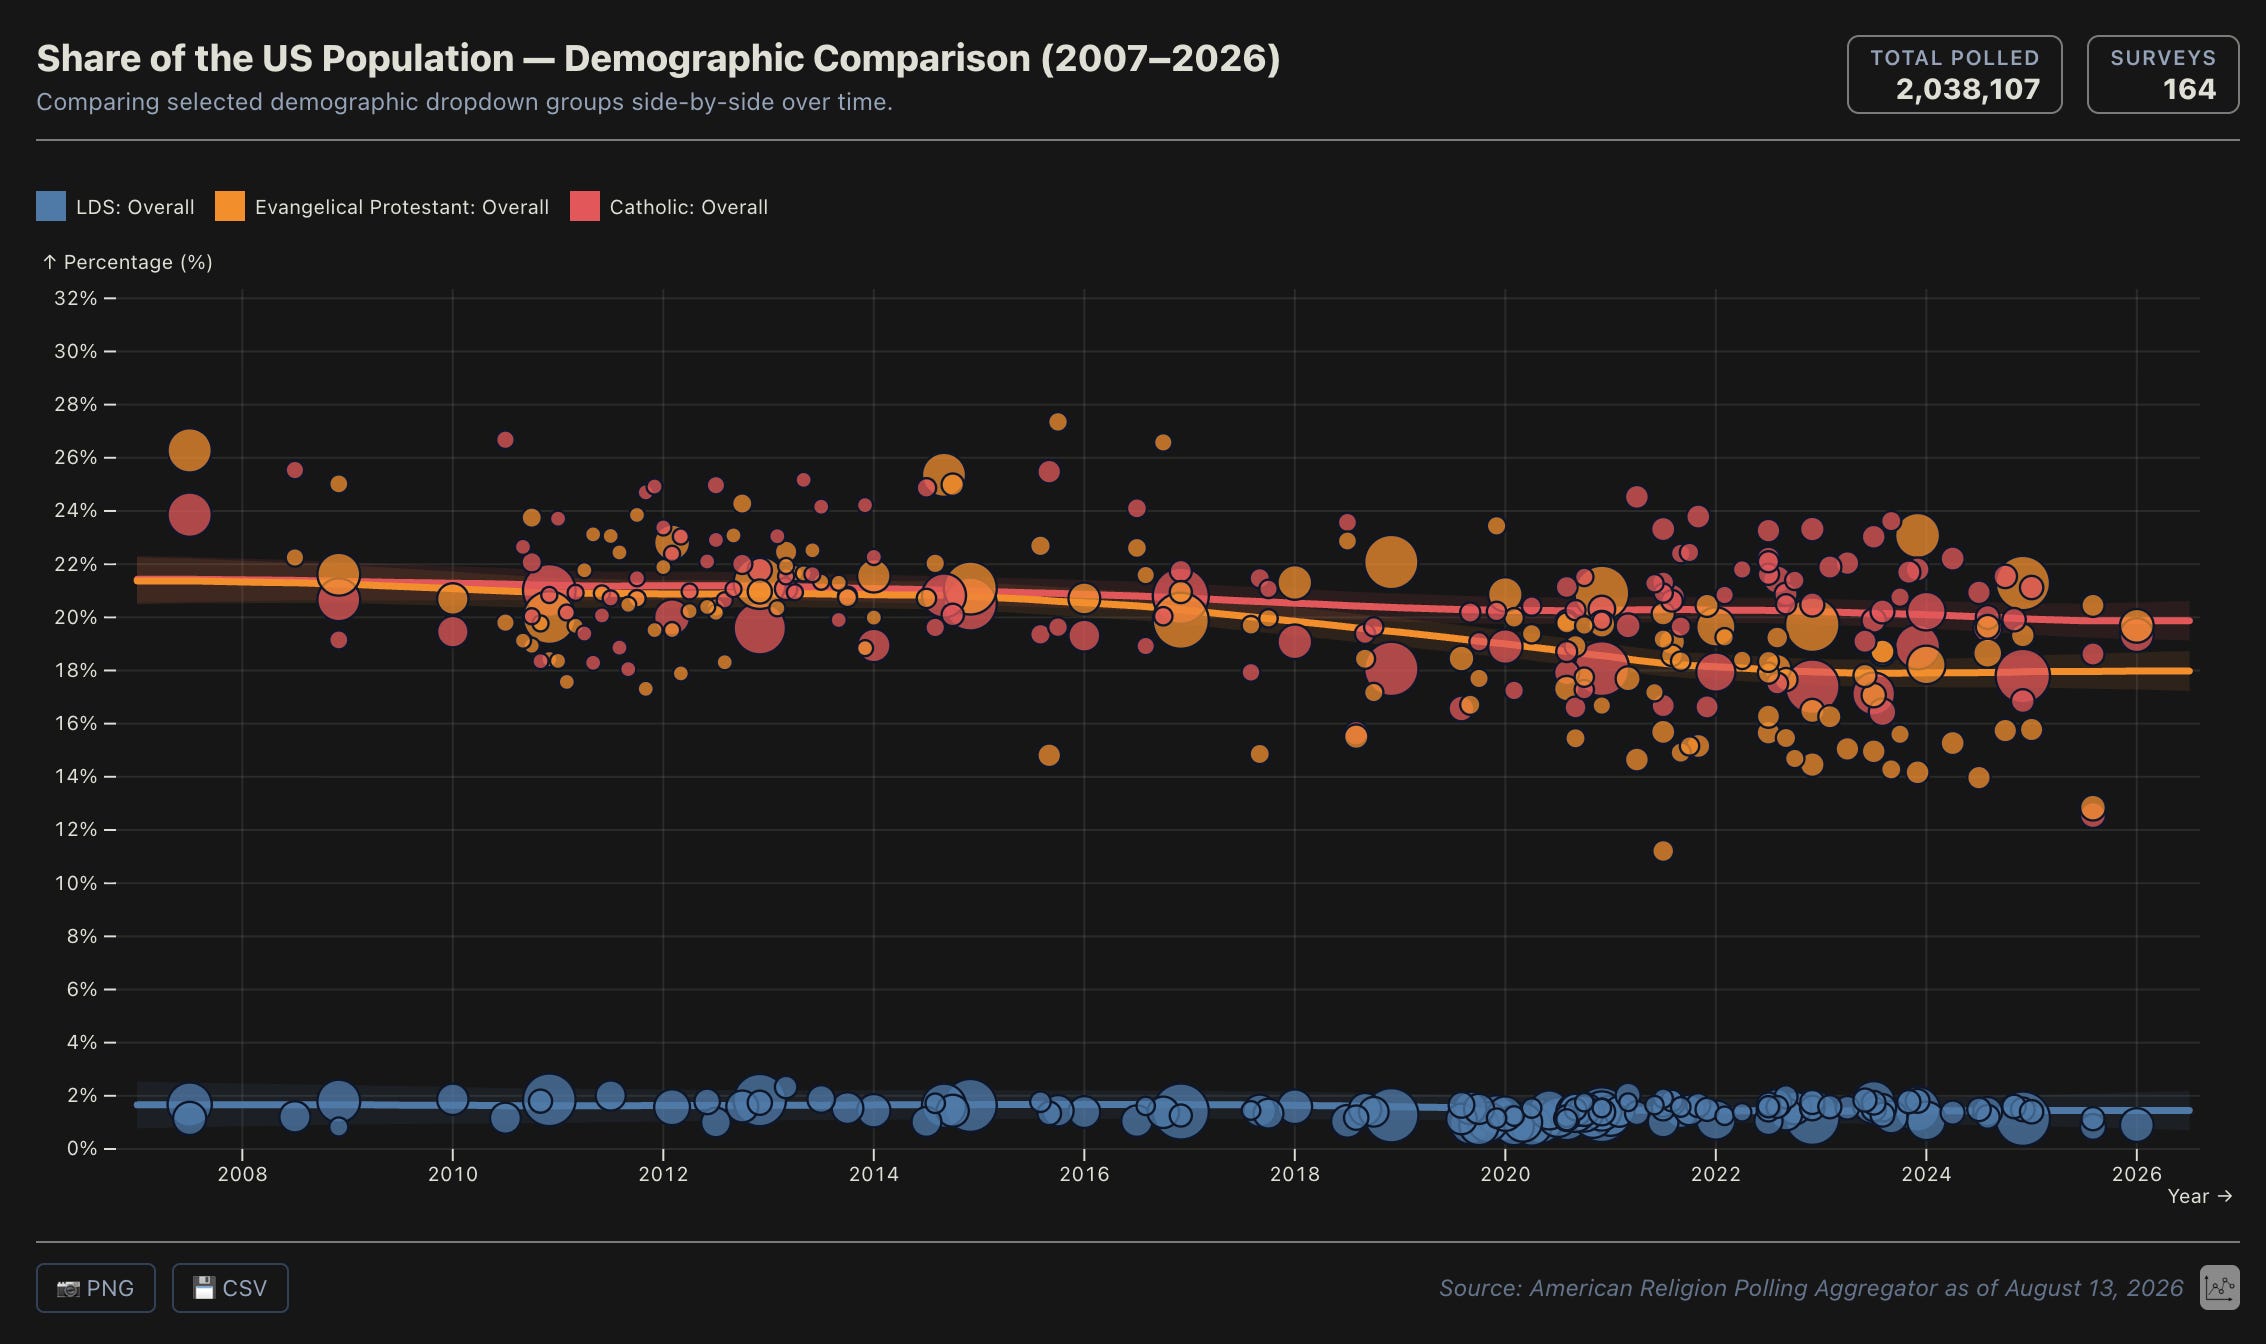
ARPA unifies publicly accessible data from 150+ survey series (including the Cooperative Election Study, Pew Research Center, General Social Survey, PRRI, and Nationscape) spanning 2007 through 2026 into a single, real-time trend line. (Imagine fancy real-time election models, but applied to religion in the US today).
It is really going to give you the best estimate of any number of religious and demographic trends available on the internet. This is true for Latter-day Saints, but is also true for the 6 other major religious traditions as well.
Rather than treating every poll as an isolated snapshot that could be the “weird survey”, ARPA models American religious identity as continuous and dynamic across major groups: Latter-day Saint, Evangelical Protestant, Catholic, Mainline Protestant, Black Protestant, Jewish, and Non-Religious.
Look across dozens of metrics like…
Population share
Church Attendance
Prayer Frequency
Personal Religious Importance
Certainty God Exists
Presidential Approval
Political Party Identification
Ideological Identification
Social Issues (Same Sex Marriage, Abortion, Death Penalty)
Demographic breaks (Stay at home parents, Gender non-binary, etc.)
And more
And especially rad, you can look at all these metrics by demographics breaks within those 7 religions!
Gender
Race
Age
Age X Gender
Utah vs Non-Utah
Married vs Single
Children vs no children
Attends church vs. doesn’t attend church
& more
What kinds of questions can ARPA answer?
Instead of guessing or arguing over what one survey said at one point in time (noise), you can answer questions like:
Generational Shifts: Are younger Latter-day Saints (under 40) attending church at lower rates than older generations, and how does that compare to young Evangelicals or Catholics over the last 15 years?
Gender & Marriage: How has the marriage rate or stay-at-home parent rate among religious women shifted compared to the national non-religious baseline?
Political Realignment: Are college-educated religious voters drifting away from traditional partisan alignments, or has their ideological identification remained stable?
Geography & Culture: Do Latter-day Saints living outside of Utah exhibit different social attitudes or religious engagement compared to those in Utah?
These examples kinda give you a taste of the many, many questions you can answer, but they’re really just scraping the surface!
Under the Hood Stats View
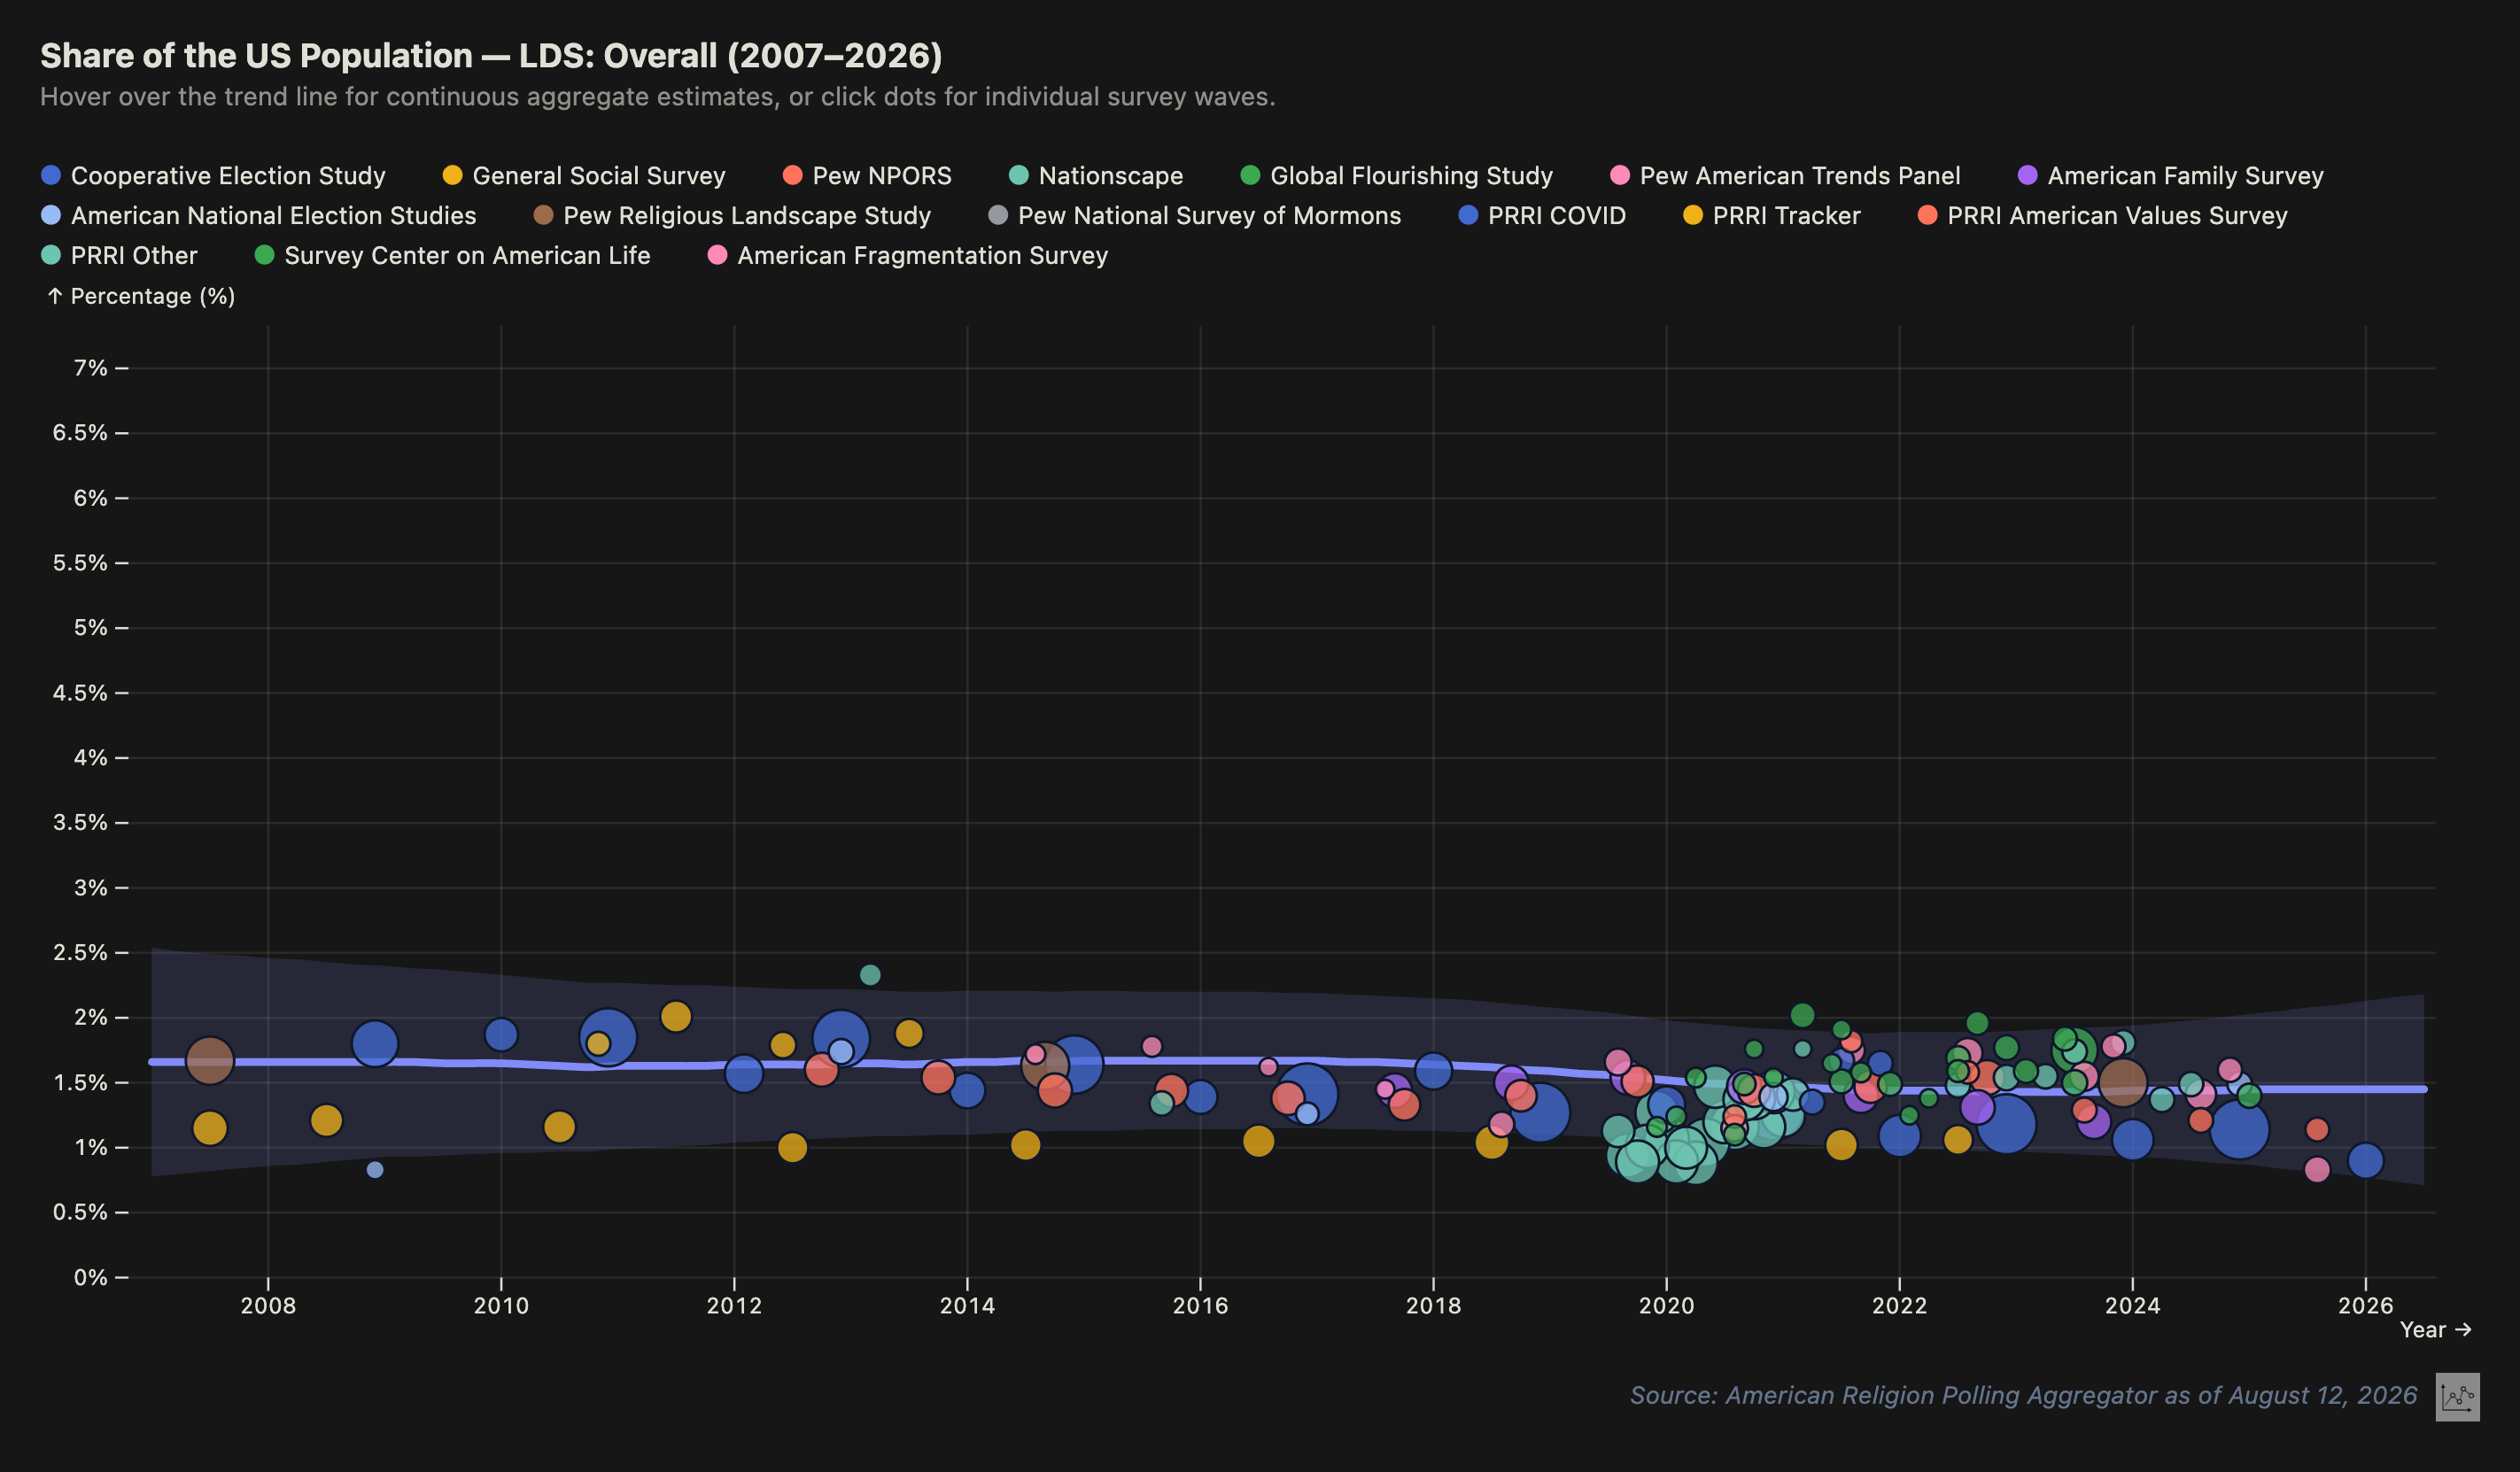
To turn the millions of rows or raw data to trendlines, ARPA runs on a multi-stage econometric pipeline:
House & Mode Bias Adjustment: Using regularized Ridge regression to measure and adjust for baseline house effects and differences between online panels and phone interviews.
Bayesian State-Space Smoothing: Applying a Kalman Filter with a Rauch-Tung-Striebel (RTS) Smoother and dynamic drift constraints to filter out random sampling noise while tracking true underlying shifts over time.
Total Survey Error Calibration: Incorporating Kish effective sample size adjustments, Laplace smoothing, and non-sampling error floors to ensure confidence bands reflect genuine statistical uncertainty—especially for smaller subgroup populations.
(For those interested in the full mathematical specifications, you can read the complete Technical Methodology Report v1.2 here.)
Introducing Membership Tiers & Publication Schedule
Building, hosting, and maintaining a state-space model and complex database that harmonizes millions of survey data rows requires ongoing server maintenance, computational power, and modeling updates as more survey are released. To keep this platform independent and sustainable for the long haul, I am opening membership tiers today.
To be 100% clear: Latter-day Saint demographics and cultural trends will remain the primary focus of this newsletter.
Going forward, I will be publishing 3 free public posts per month alongside 1 exclusive, deep-dive post for Pro subscribers.
Here is how access is structured:
🆓 Free Tier ($0)
3 Free monthly data posts: Open access to 3 public-facing posts per month breaking down major macro shifts and cultural trends. However, the archives are paywalled after 30 days.
Free Reports: Whenever they are released
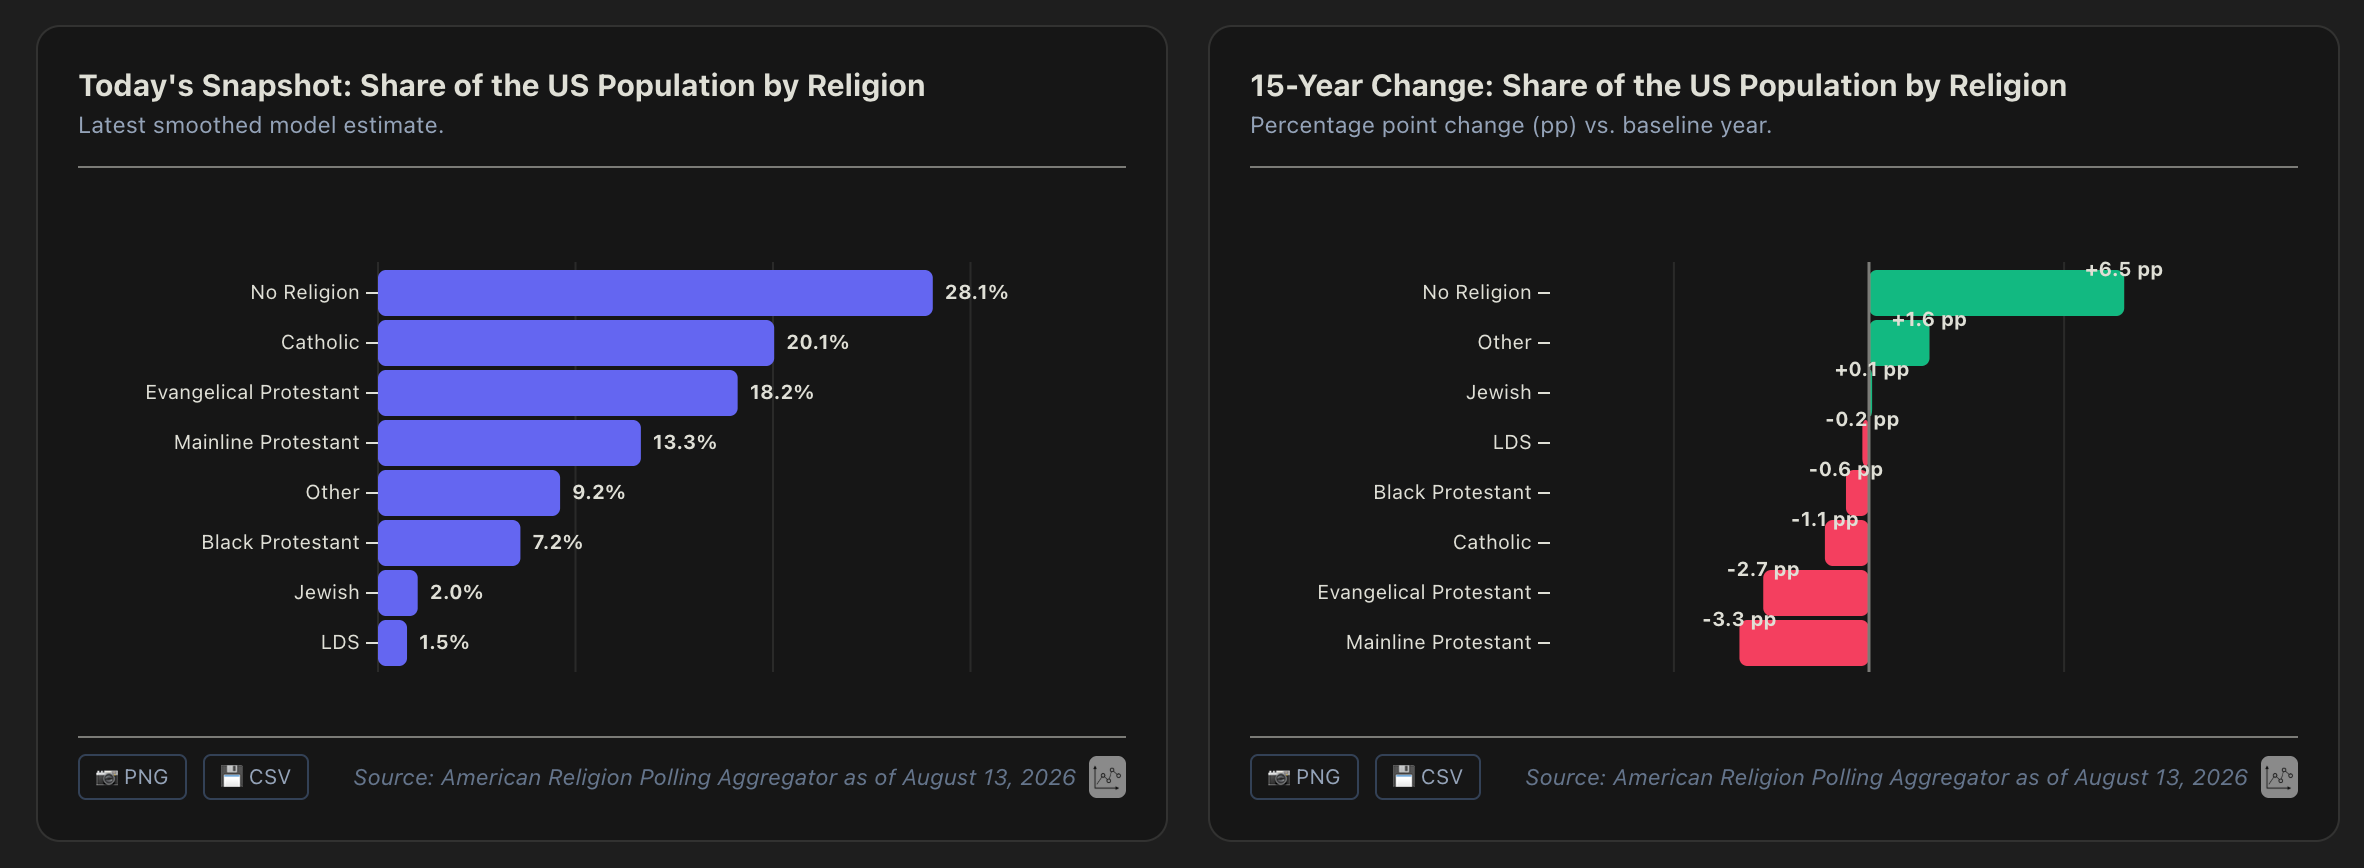
Dashboard Access For Overall Trends: Explore overall 15-year national trendlines across all 7 major religious groups.
KPI Summaries & Statistical Tests: View current point estimates, net 15-year changes, and 15-year statistical significance test badges.
💎 Pro Tier — For Power Users, Researchers & Data Nerds (or if you want to support the work I’m doing here 🙂)
1 Exclusive Monthly Paid Briefing: Access my monthly deep-dive post featuring advanced cross-tab breaks, exclusive data analyses, etc.
Full access to the complete Mormon Metrics archive of 100+ data analysis posts about Mormons released the past 2 years (posts auto-archive to paid after 30 days).
25+ Deep Demographic Cross-Tabs: Unlock granular subgroup filters across all 7 cohorts on the live dashboard—including Age & Gender Intersections, Utah vs. Non-Utah, Weekly Attendance, Income, Education, Marital Status and more.
Publication-Ready Exports: One-click high-resolution PNG chart rendering and single-chart CSV vector downloads for your own articles, decks, or research papers.
Subscriber Community: Direct access to paid subscriber group chat, Q&A, and voting on future research direction and posts.
🎉 Launch Week Founding Offer — 20% Off For Life:
To thank the early readers who have supported this work over the last two years, I’m offering a 20% lifetime discount on the Pro Tier for anyone who subscribes during launch week.
Pro Annual: $64/year (normally $80/year) — Locks in $64/yr forever.
Pro Monthly: $6.40/month (normally $8/month)
Claim Your 20% Lifetime Founding Discount Here
(Discount offer ends Friday August 21st 2026 at midnight, so in one week!)
🗞️ Journalism Tier ($1,500/year)
5 Team Seats with full media publishing and attribution rights for the dashboard and commercial media and reprint license for other charts and analysis on any Mormon Metrics analysis.
Full access to premium posts and Mormon Metrics post archive.
Fast-Track Fact-Checking: Direct, rapid-turnaround access to me for survey verification, statistical significance checks, and custom cross-tabs on tight newsroom deadlines.
48-Hour Embargoed Previews: Early access to white papers and major analytical reports.
🏛️ Institutional Tier ($5,000/year)
Want access to this continually updating underlying database as more surveys drop? Want to track a certain religious demographic group over time with quarterly updates? Need polling/data advice, but want to save thousands of dollars without hiring a full time data scientist?
Everything in the Journalism Tier and Pro Tier and…
Full Bulk Database Access: Complete aggregated survey data matrix across all 150+ survey series delivered in standardized CSV/Parquet formats.
Quarterly Data Updates And Custom Demographic Tracking Updates: Quarterly reports detailing movement in desired tracked crosstabs and new data sets added.
5 Hours of Direct Advisory or Onboarding: Dedicated setup session with Bass Empirical to assist your team with dataset integration, variable cross-tab selection, and research project alignment. (Additional custom modeling or projects available at an add-on rate of $250/hr).
Take the New Dashboard For a Spin
The dashboard is live, fully interactive, and ready to explore right now!
👉 Click here to launch the American Religion Polling Aggregator also you can find it in one of the webpage tabs on the Mormon Metrics website.
Thank you to everyone who has read, shared, and supported this newsletter over the last two years. Your engagement made building this tool possible. Check out the dashboard, try out the metrics, and let me know what you think in the comments!
— Alex Bass
Mormon Metrics / Bass Empirical