
Gender & Never Married Singles Age 35+
Is There A Gender Difference In Older Single Church Leavers?


Introduction
I recently had a conversation with a 40 year old single woman in the church who attended a mid-singles branch. She expressed some frustration that there are very few older single men in the church. She theorized that there was a “male dropoff point” where older single men were no longer interested in participating in church and that would explain the few men that attended the mid-singles branches.
Ever since this conversation, I wanted to test this theory. Is there a gender component to singles leaving the church? Are single males more likely to leave at a certain age? If so, when is this “male dropoff point“?
I started answering this question a few weeks ago. TLDR singles in general were more likely to leave and more likely to leave with age. I tested the gender component, but null results. But perhaps we just had an n-size that was too small and maybe by combining all three waves and visualizing the data we can see better what's going on.

So, today, we’re going to try and answer this question by comparing the age and gender distributions of single never marrieds by mormon stayers and mormon leavers. I have combined all three waves of the Pew Religious Landscape survey to help with our nsize (which still isn’t very large >100 single stayers and >100 single leavers), but lets make some visualizations and see what we find.
Charts
Let’s first look at the age distribution for each group overall - everyone not just singles.
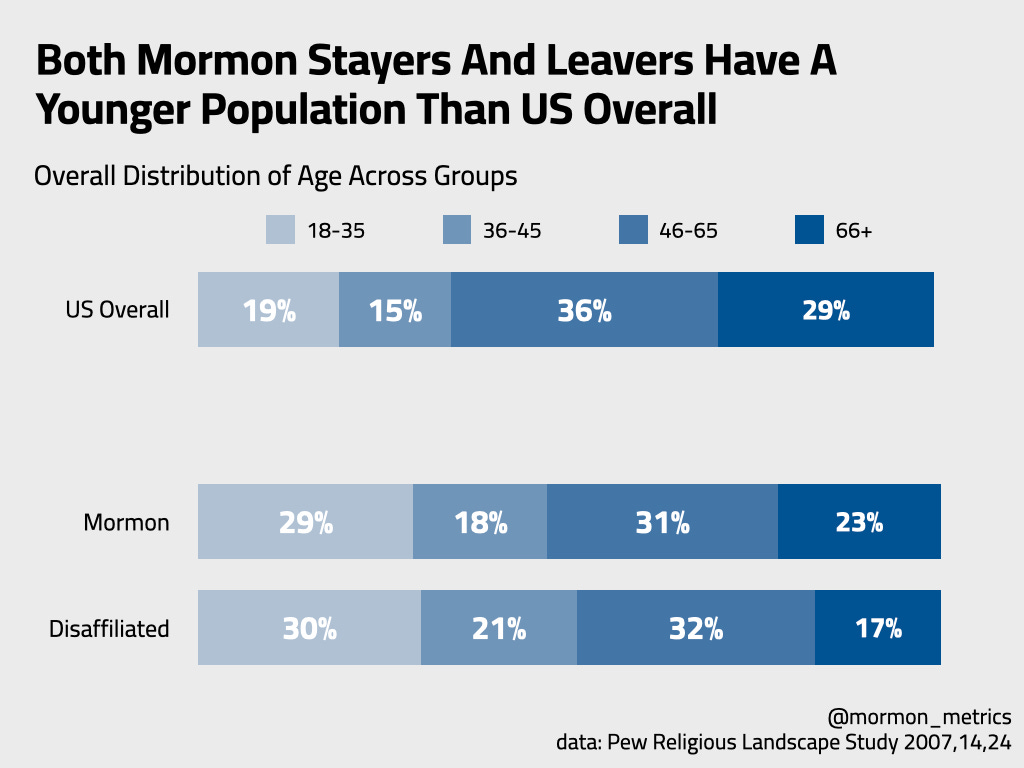
We see that in general Mormons and Disaffiliated Mormons have an age distribution that looks pretty similar to each other. Mormons are slightly older than Disaffiliated Mormons, but when compared to the US overall population, both groups look young.
Why are the Mormons and Disaffiliated Mormons so young? I guess it just boils down to “Mormons just have more kids.” This supports my last post where I found Active Mormon fertility hasn’t changed much in the last 10 years (the same proportion have 4 or more kids). Its still high!

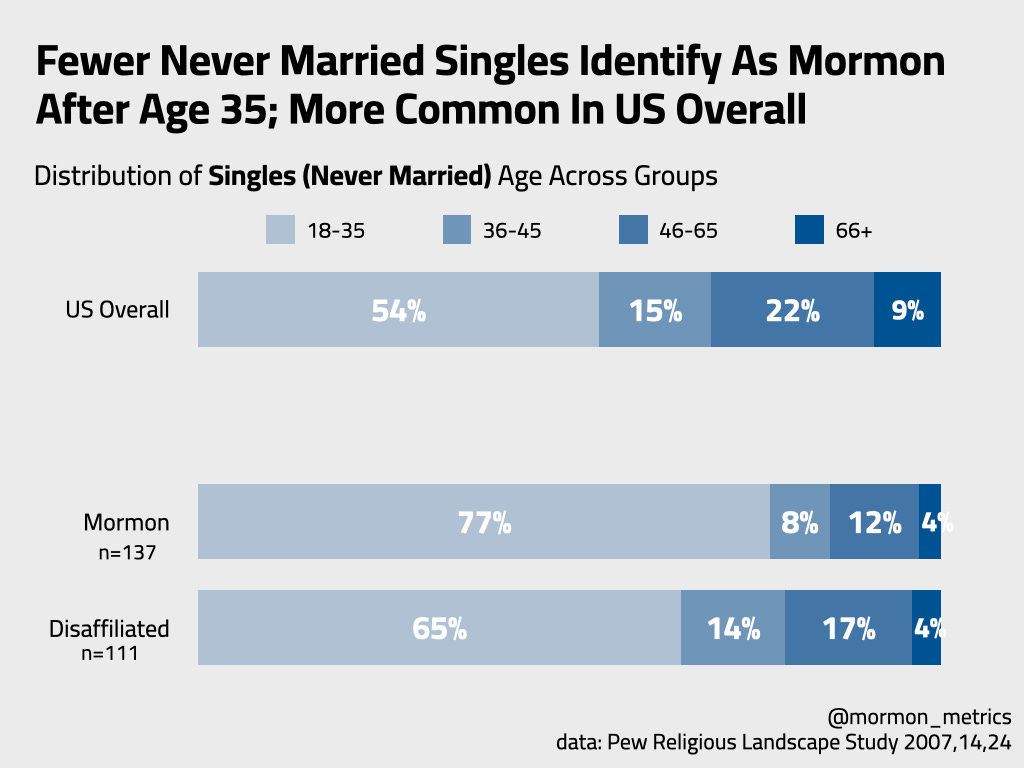
In theory, the Mormon and Disaffiliated Mormon groups are zero sum. You take away older never married singles from one group and they go to the other group. That is what I visualize here. As we found before, older never married singles had an increasing probability of leaving with age and older singles are more likely to be found in the disaffiliated group!
From this data, if there were a drop-off point I would say age 35 which is also the age when singles “age out” of the younger ward and into the mid-singles ward. After age 35, the disaffiliated age proportion is larger from that point forward. Of course, It would be great if we had the exact age of respondents instead of an age range, but this is the best we can do given our data privacy limitations.
Now let’s look at this by gender. If the theory is correct, we should see big differences in the gender distribution of Mormon vs. Disaffiliated.
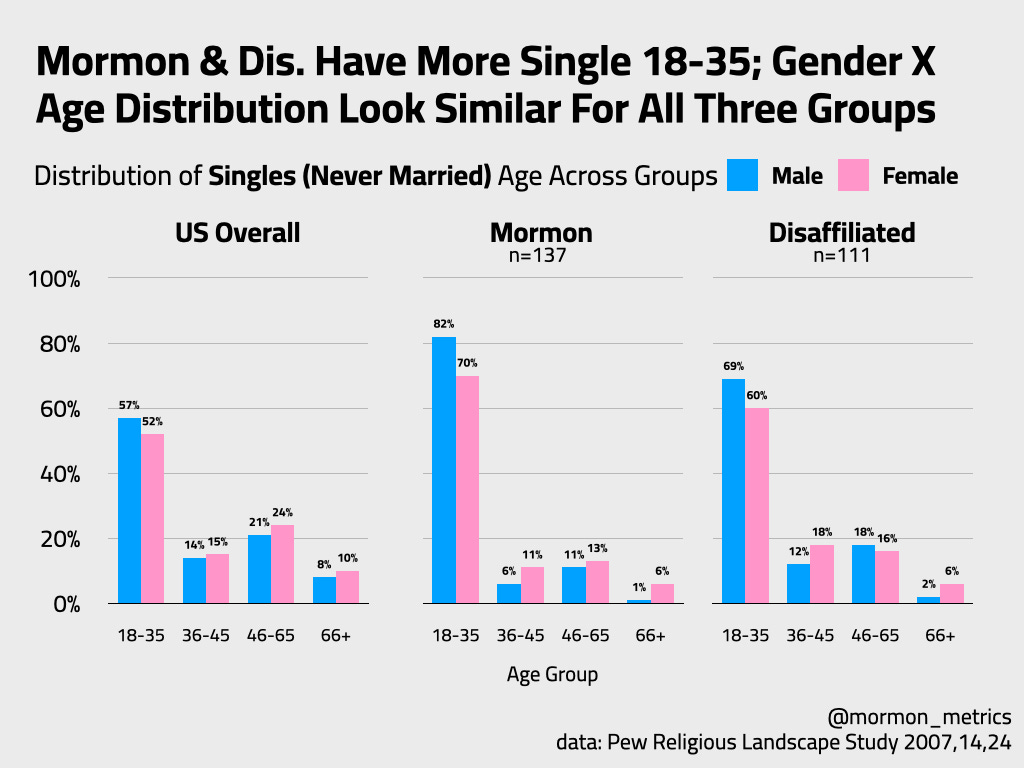
Honestly, what I am seeing here confirms that there isn’t a gender difference between single Mormons and single Disaffiliated Mormons. Besides there being just more young people among Mormons and Disaffiliated (like we previously observed), the gender breakdowns look the same across age between all 3 groups!
The data shown on the chart above is a little frustrating for me because when you look at Cooperative Election Study(below) and American Community Survey data, there are proportionally more older single men than older single women which is the opposite of what the PRLS shows. I would obviously trust the ACS and the CES more than our sample size of 137 single mormons and 111 disaffiliated Mormons in the PRLS, but only the PRLS has data on disaffiliated Mormons!
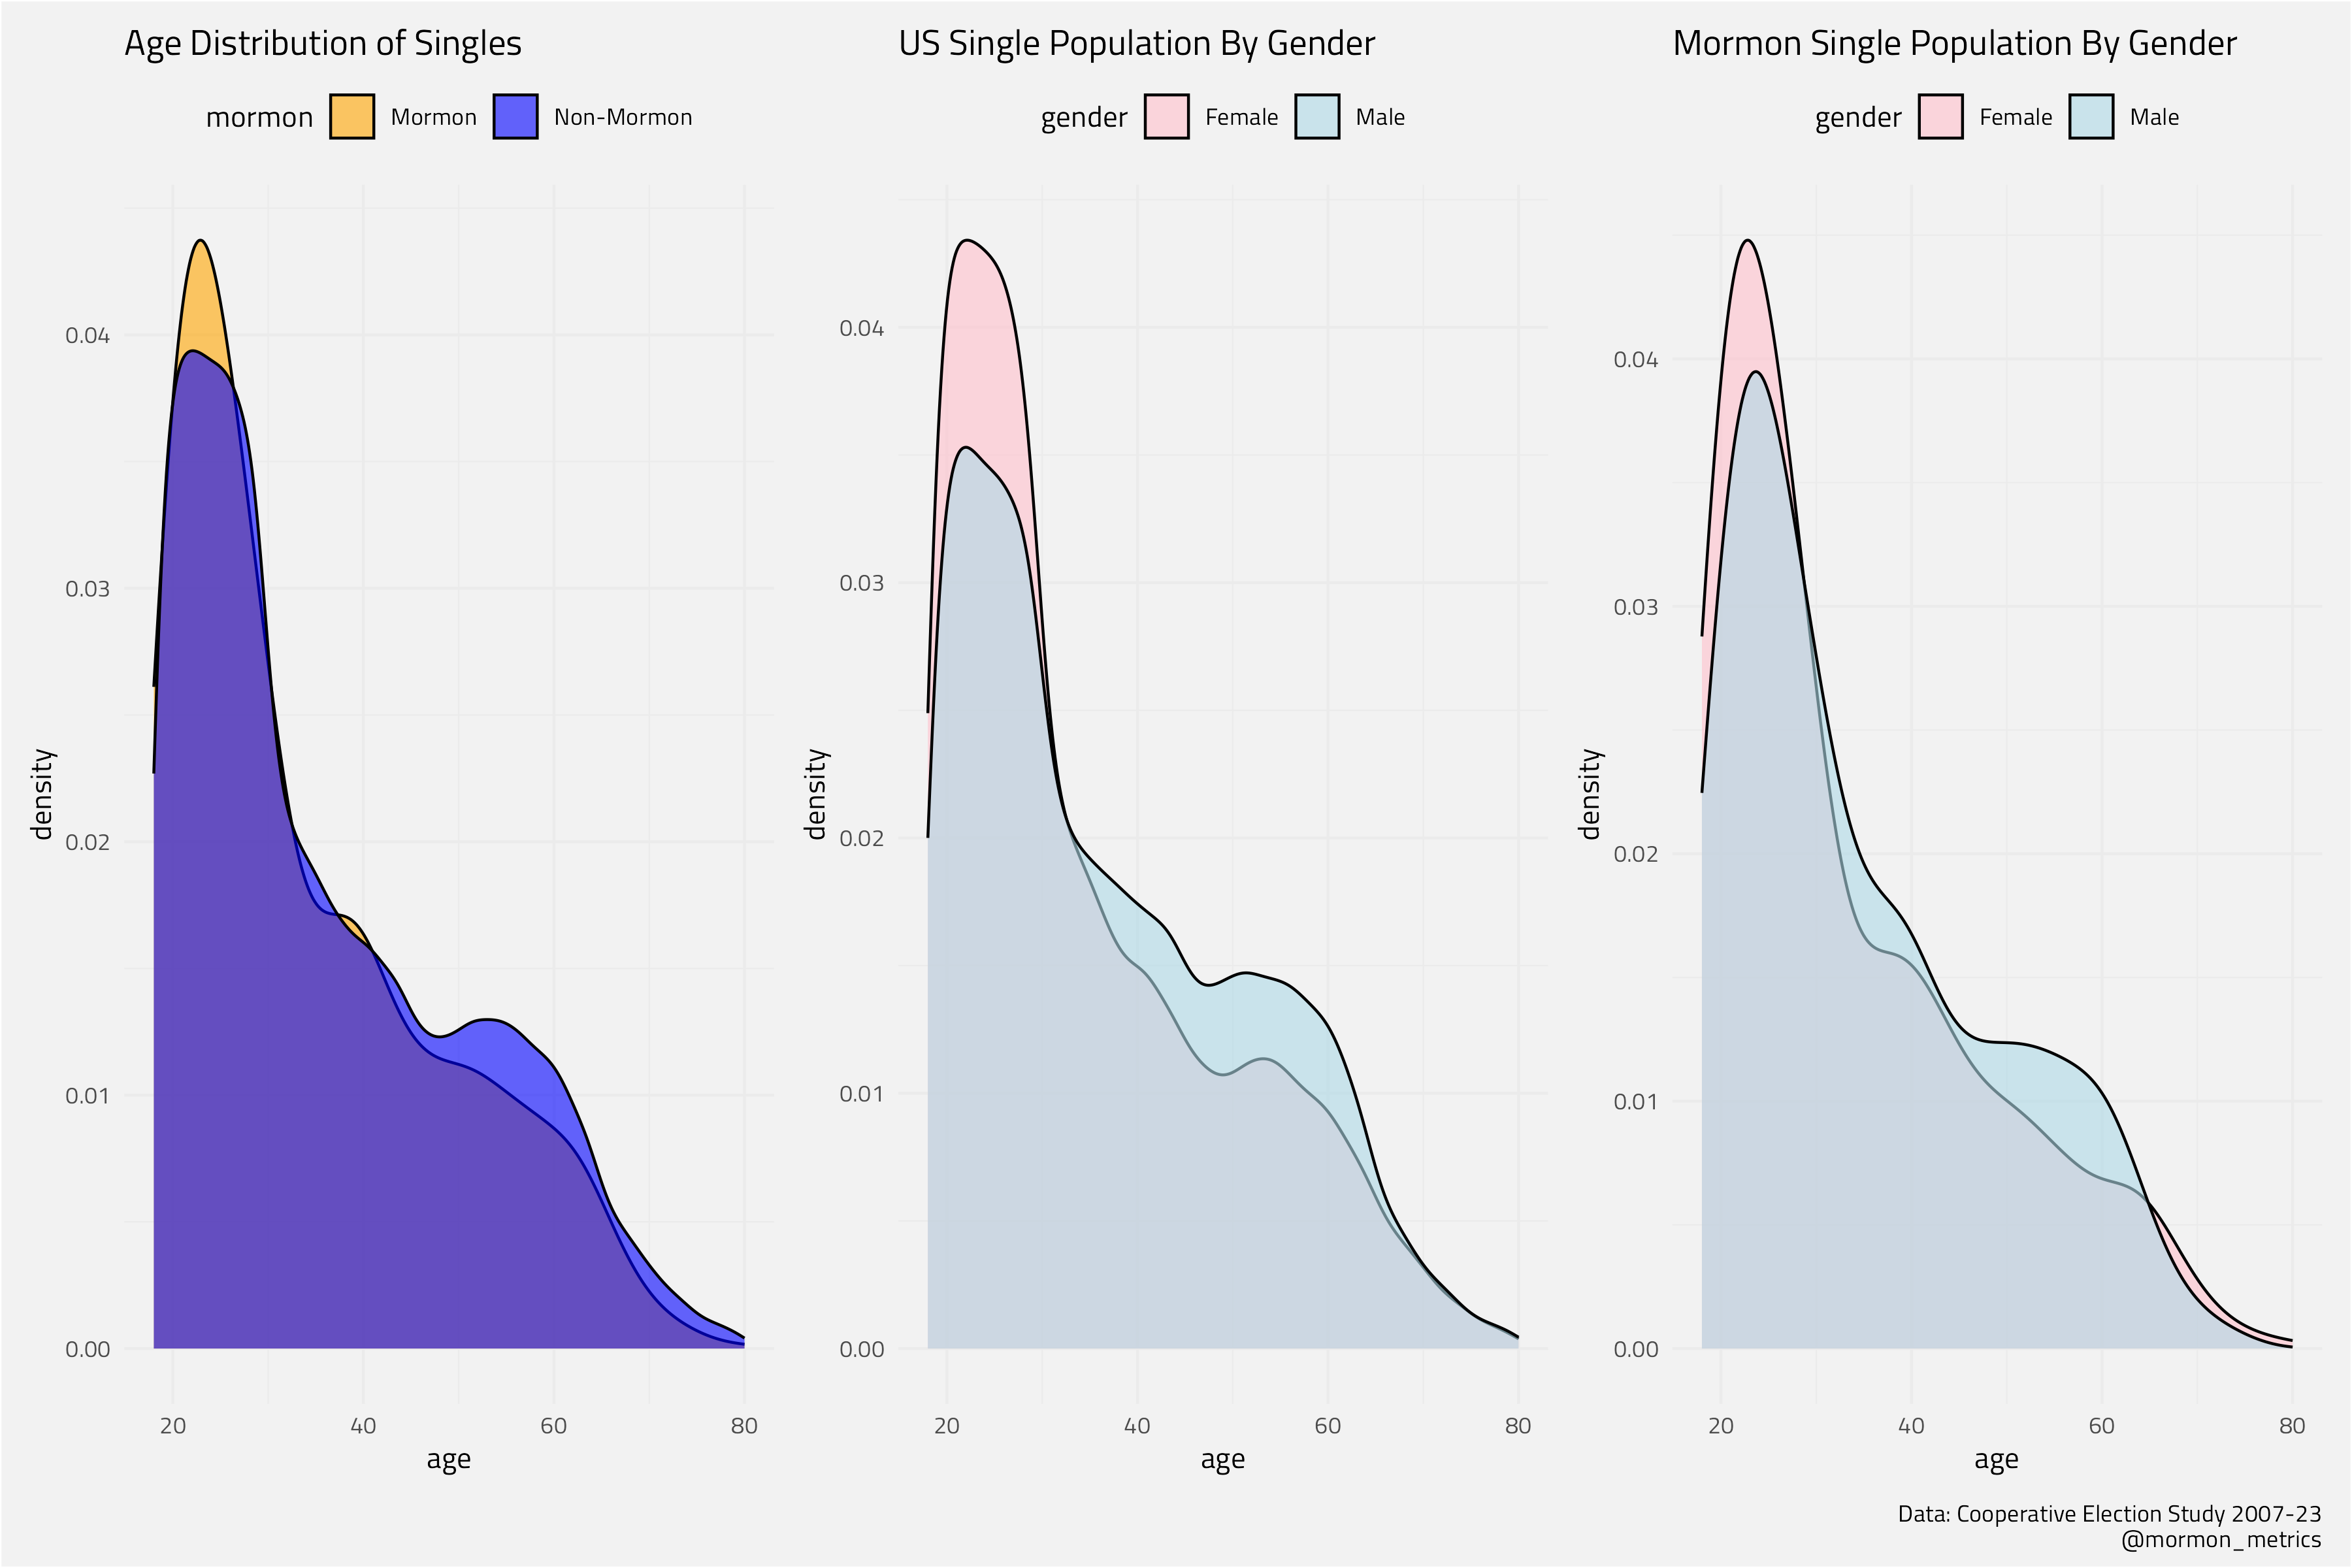
Analyzing these density plots from the CES (mormon single n > 700), men seem to be more prevalent than women after age 35 in the US overall and the Mormon population.
So, what do I make of all of this? It’s hard to say whether there are more older single men or older single women in the Mormon population because of the conflicting examples in our datasets (most likely the CES is right though since it has a larger sample). What I can say is that the gender distribution of singles seems to be quite similar within datasets comparing the Mormon population to other ones. In the CES, the gender distributions between the US overall population and mormon population look similar. In the PRLS, the gender distributions between the US overall population, mormon population, and disaffiliated Mormon look similar. If there were gender differences, we should be able to see them!
What this means is… I don’t think gender plays a role in older singles leaving the church and the “male drop-off point“ could be a myth. While there is no gendered single dropoff, there is a gender-agnostic single drop-off point in Mormon affiliation after age 35.
But I am missing a key piece of the puzzle here… we’ve looked at Mormon affiliation, but what about church attendance?
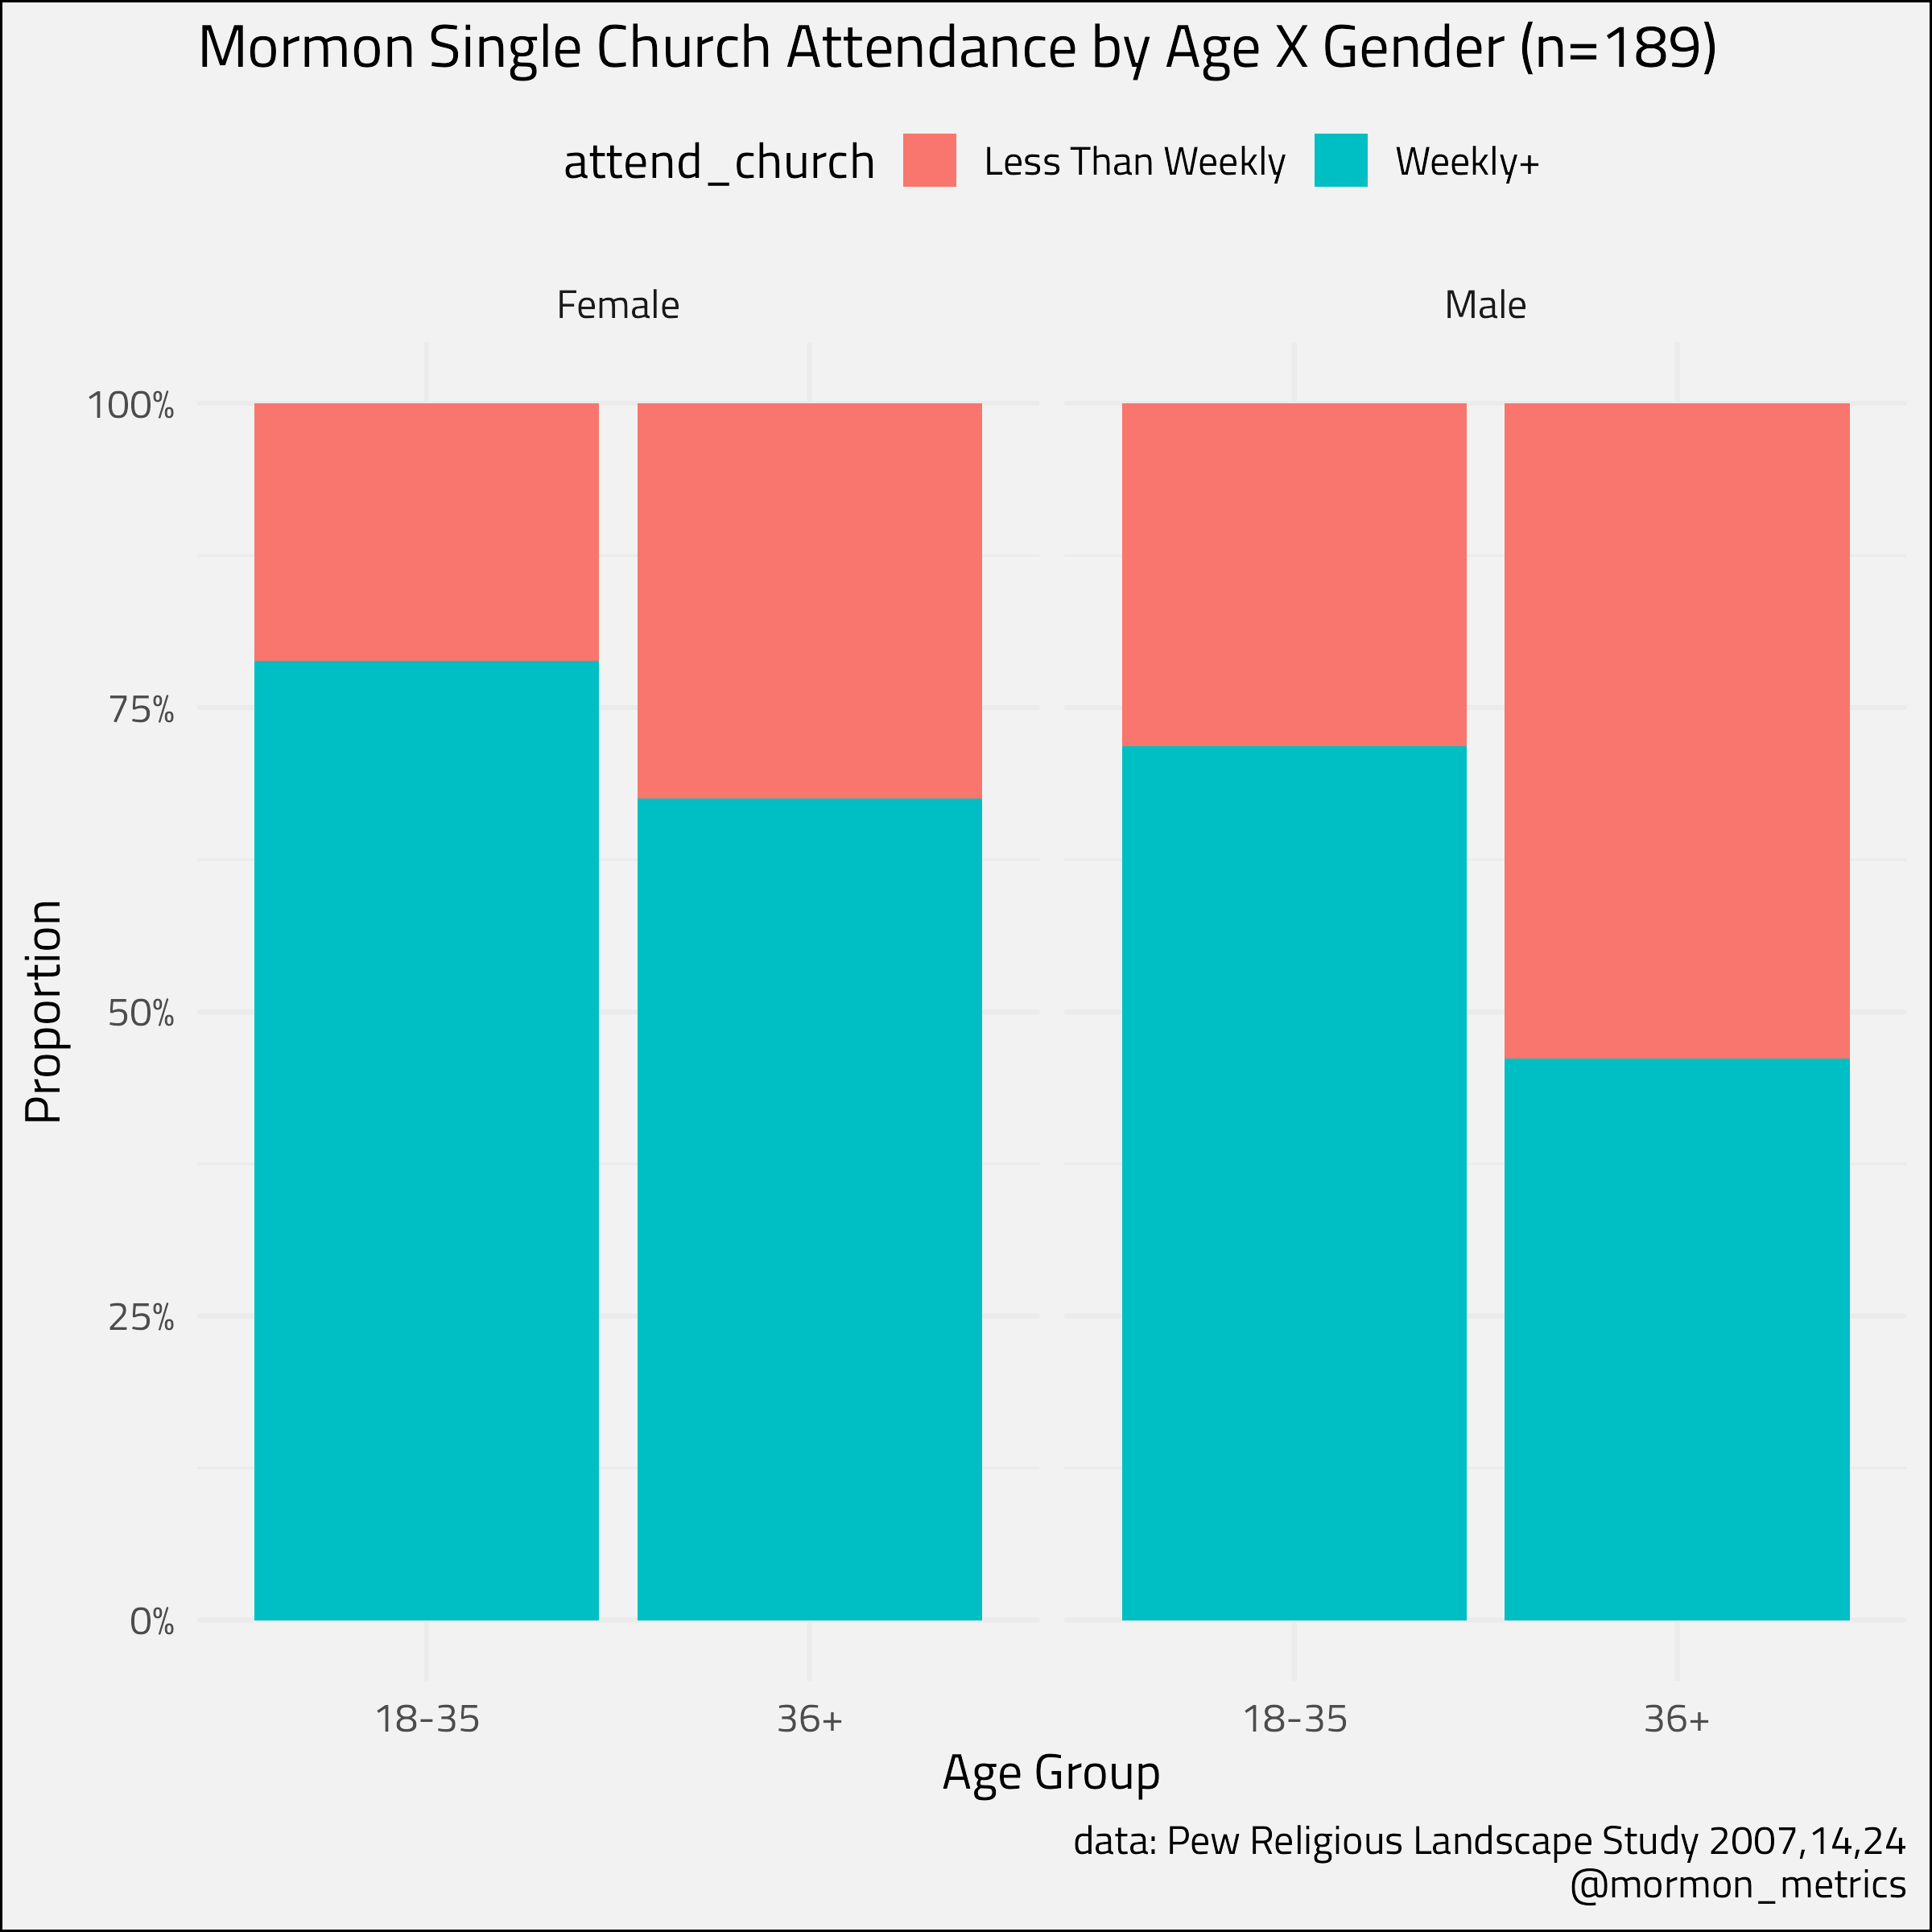
For one last check, I looked at Mormon single church attendance by age and gender. While there isn’t a strong difference by in single disaffiliation by gender, there is a difference in single church attendance by gender. Single men after age 35 are less likely to attend church weekly which could explain my friends lack of male sightings in mid singles wards.
This data raises an interesting question… Why do single men attend less church as they age yet still keep their “Mormon“ identity? Very open to other’s theories on this.
Short Blurb On Divorced Members By Disaffiliation, Age, And Gender
I had someone reach out asking for a break among divorced Mormons, so since I had all the data pulled up I figured I could share a chart or two on this.
We have to interpret the following charts with caution since in our combined sample for the PRLS there is a total of 174 divorcees (78 raised Mormon and still identify + 96 Disaffiliated).
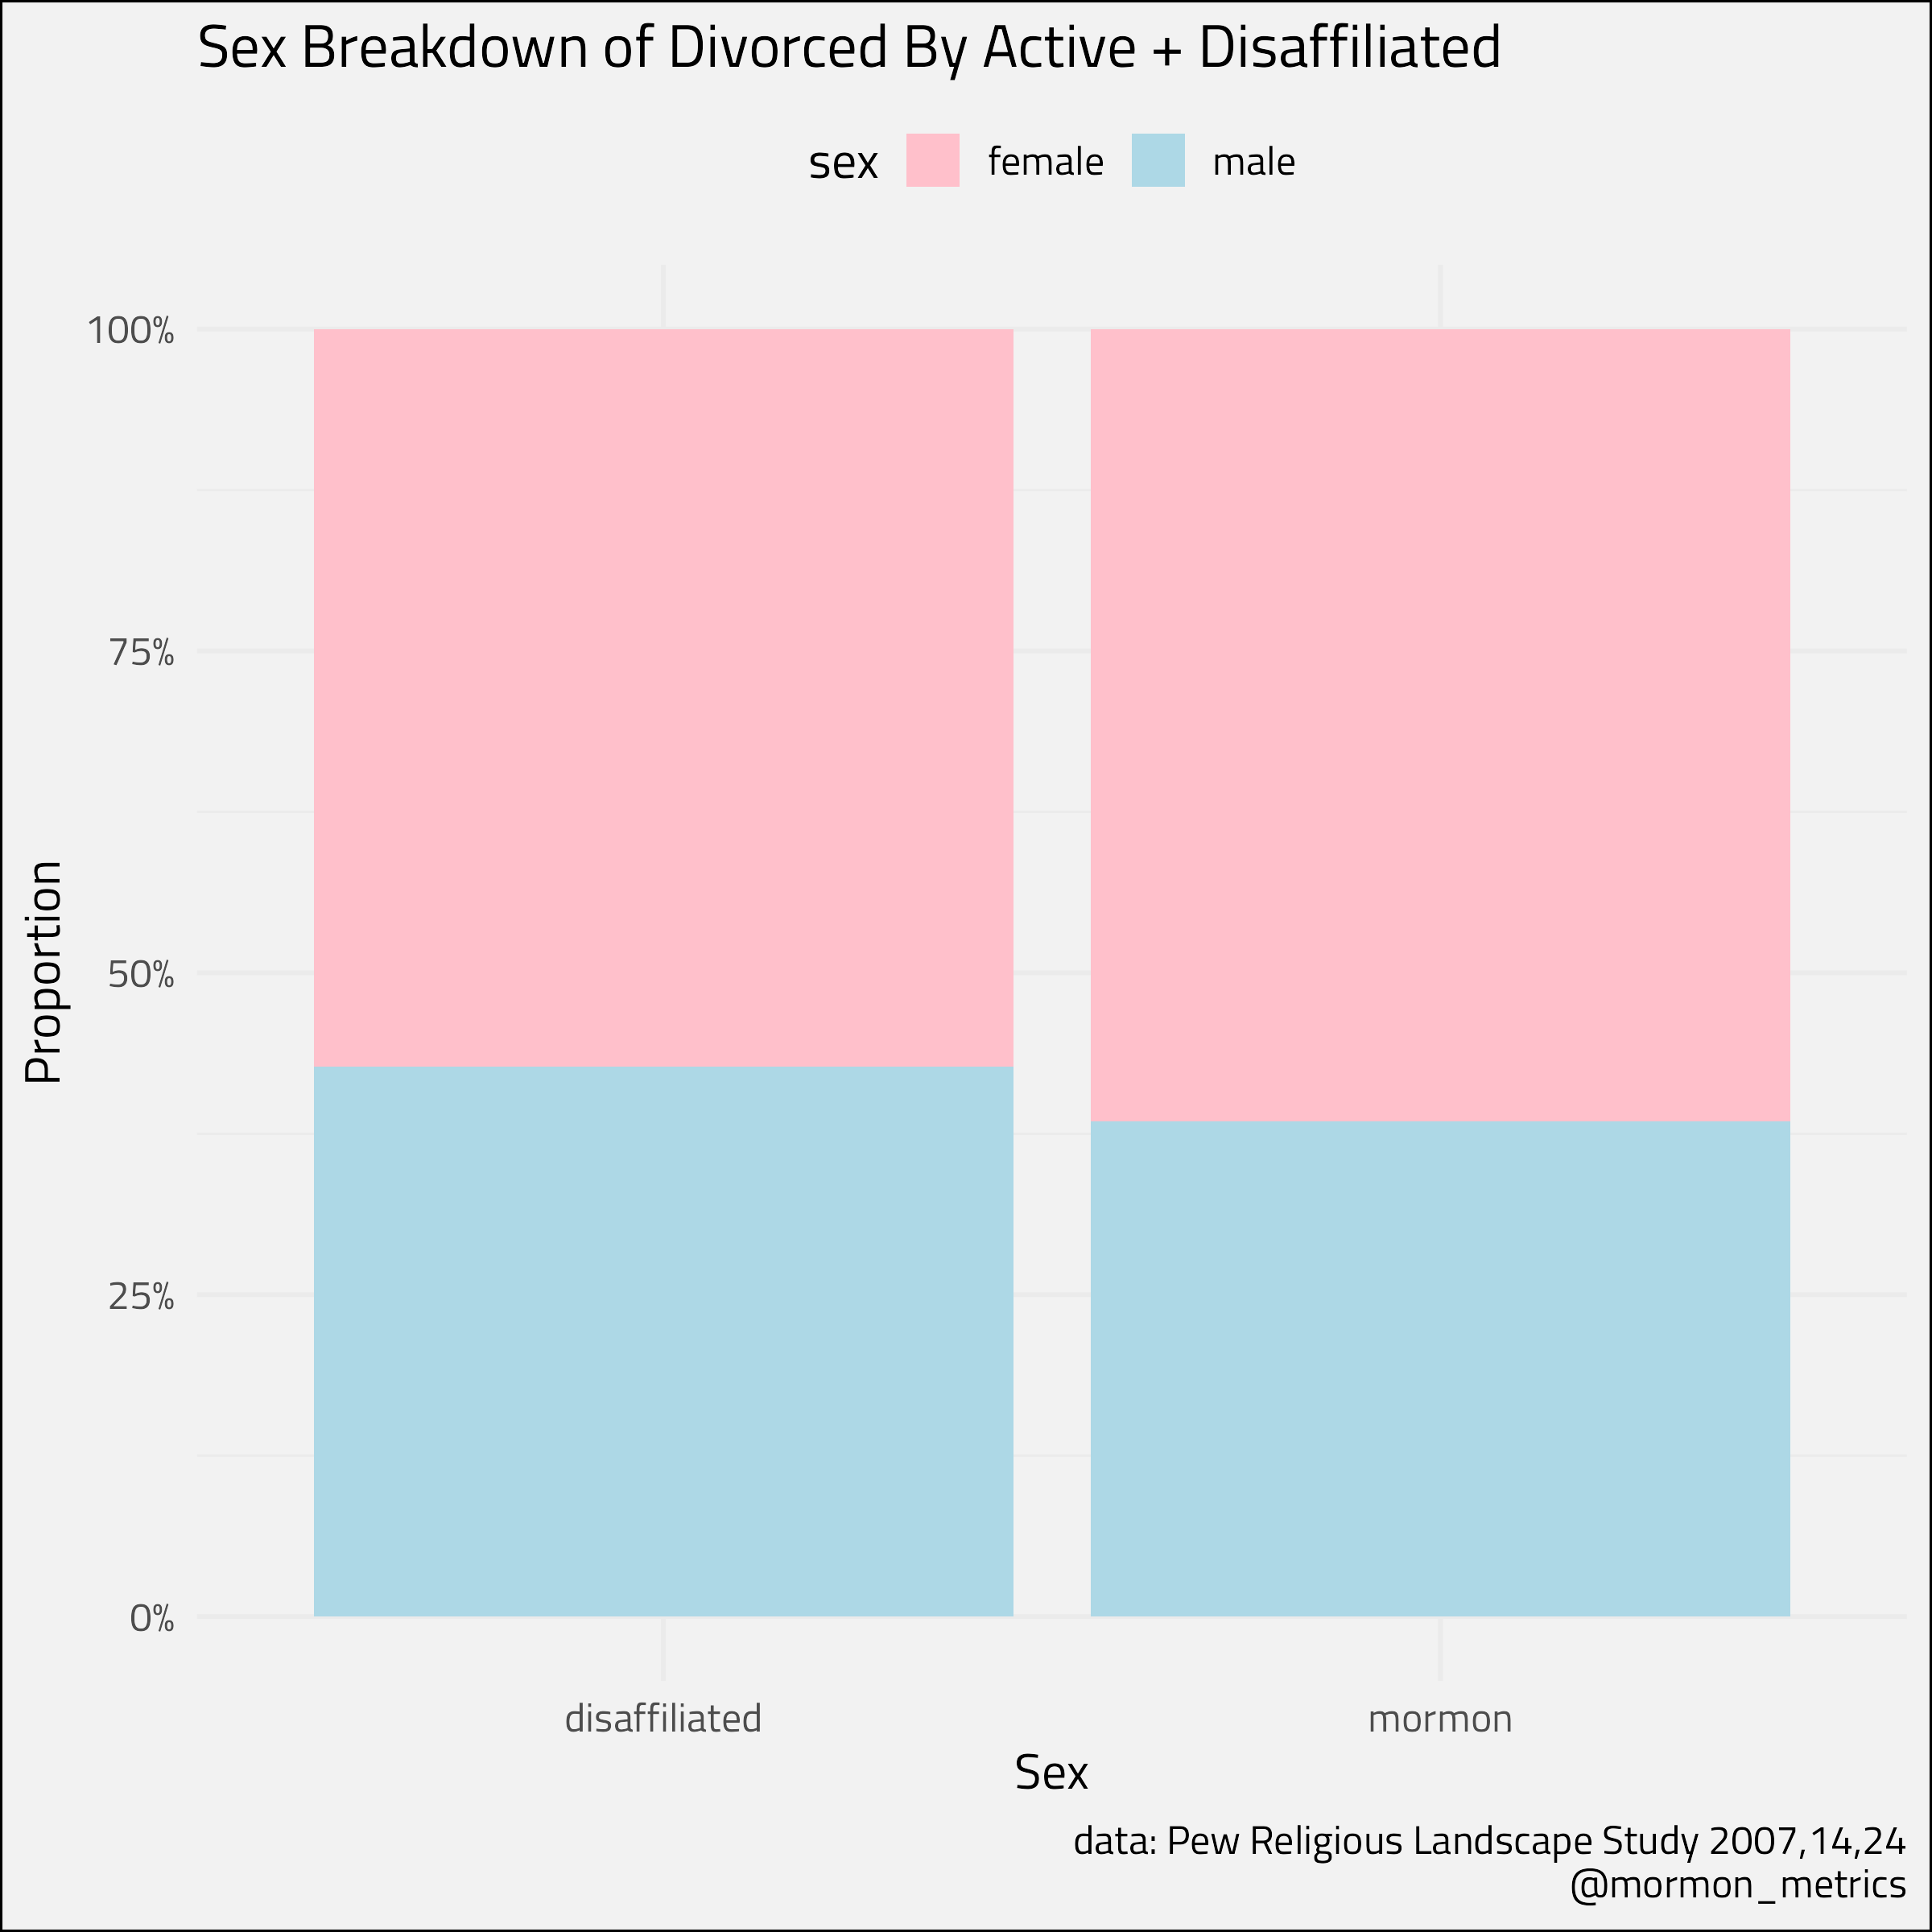
I wouldn’t pay as much attention to the baseline levels of male vs. female because the unweighted combined sample was slanted female. We should focus on the difference between the two groups. In this case, there really isn’t much difference, but divorced males are slightly more likely to be in the disaffiliated group (39%Male vs. 43%Male).
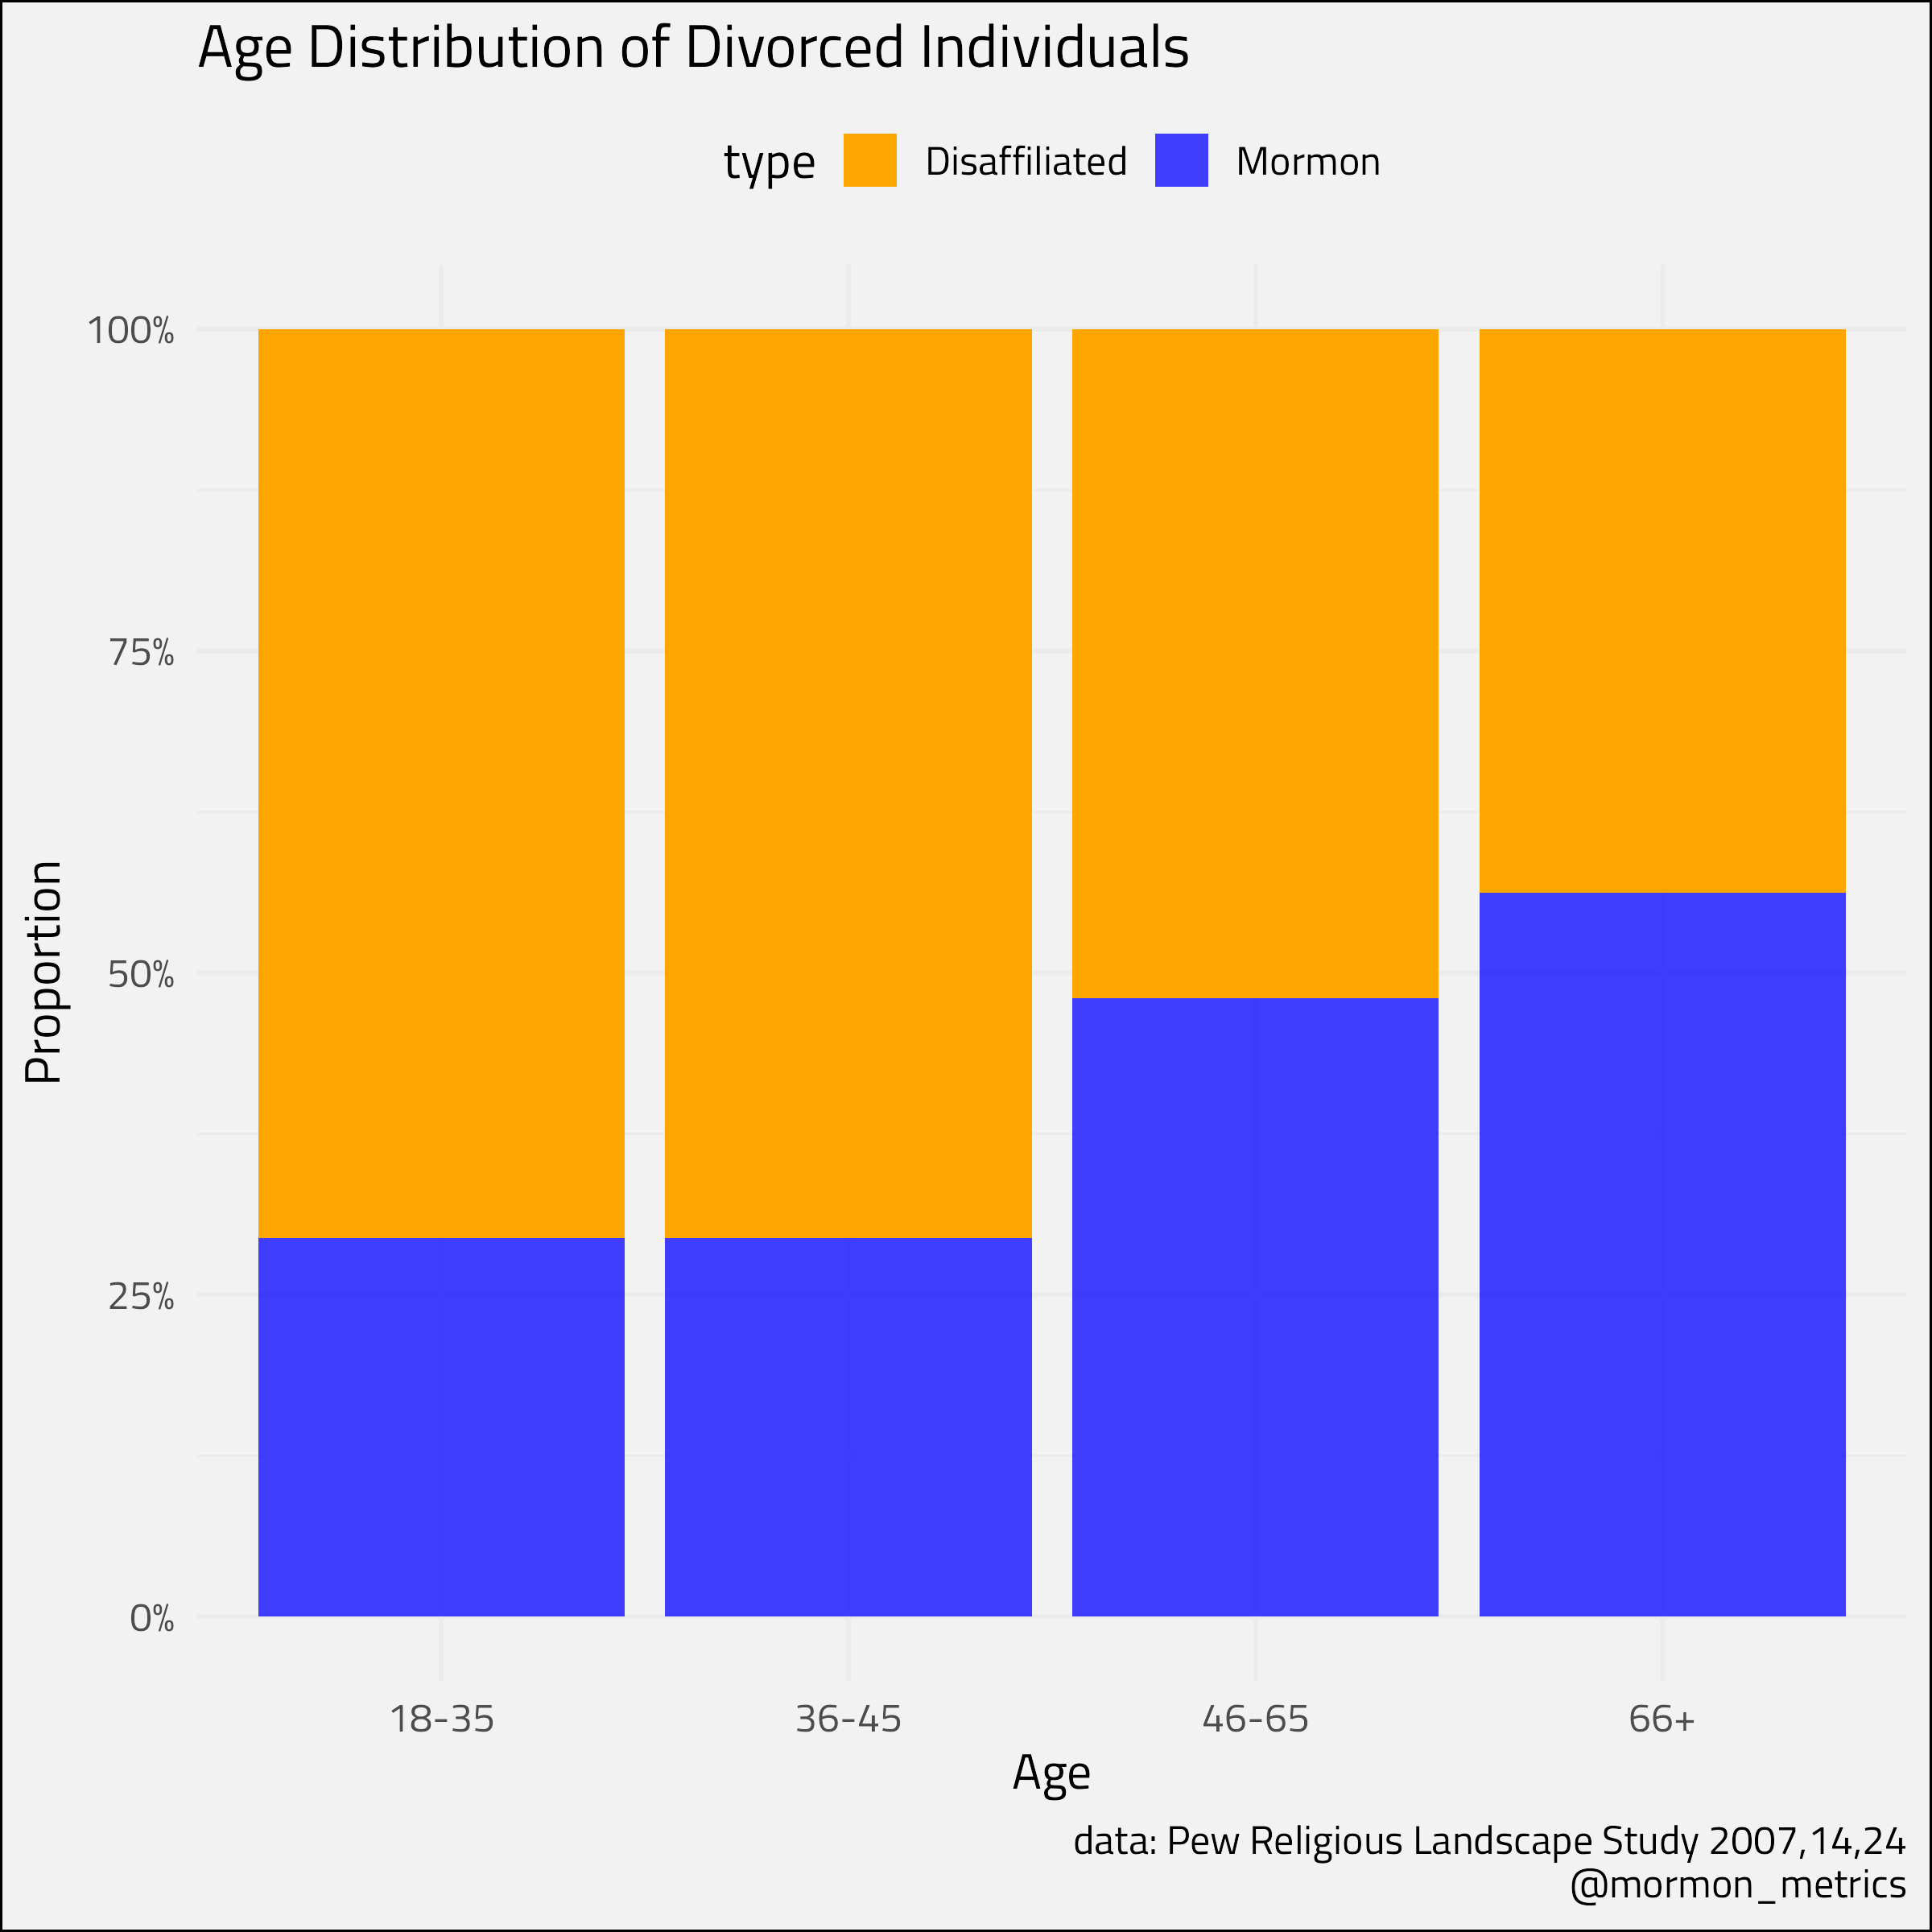
Similar to what I found in the post I linked at the beginning, younger divorced individuals are more likely to leave than older ones. We can see that in our chart above. The sample sizes are quite low in the younger age categories with most divorced people found in the two older age groupings.
I’ll share the next week title as a teaser because I’m excited about it 😂 “Does BYU Make Students More Liberal?” 🤯
See you next week!
Code available here.