
A Reader Sharpened Last Week's Analysis. Here's What Changed.
Let's Account For Regional, Country-level, and State-level Growth in These Charts


Last week I posted about US LDS membership declining for the first time, with a state-by-state breakdown. The post got more engagement than usual — and one reader, Jason from the Bay Area, CA (East Bay) / Walnut Creek Stake, emailed me a sharper version of the question and some of his own analysis. Instead of asking how much LDS membership grew in each state, ask whether it grew faster or slower than the underlying state population.
He’s right that this is the better question. If 100,000 people move to Texas and a few thousand happen to be Latter-day Saints, that’s not LDS growth — that’s population growth that happens to include some LDS people. The metric you actually want is LDS percentage growth minus population percentage growth: positive numbers mean the church is gaining share, negative numbers mean it’s losing ground.
This week is the corrected analysis, expanded to two time horizons and two geographic scales. Let’s explore.
Recent state-level: the corrected map
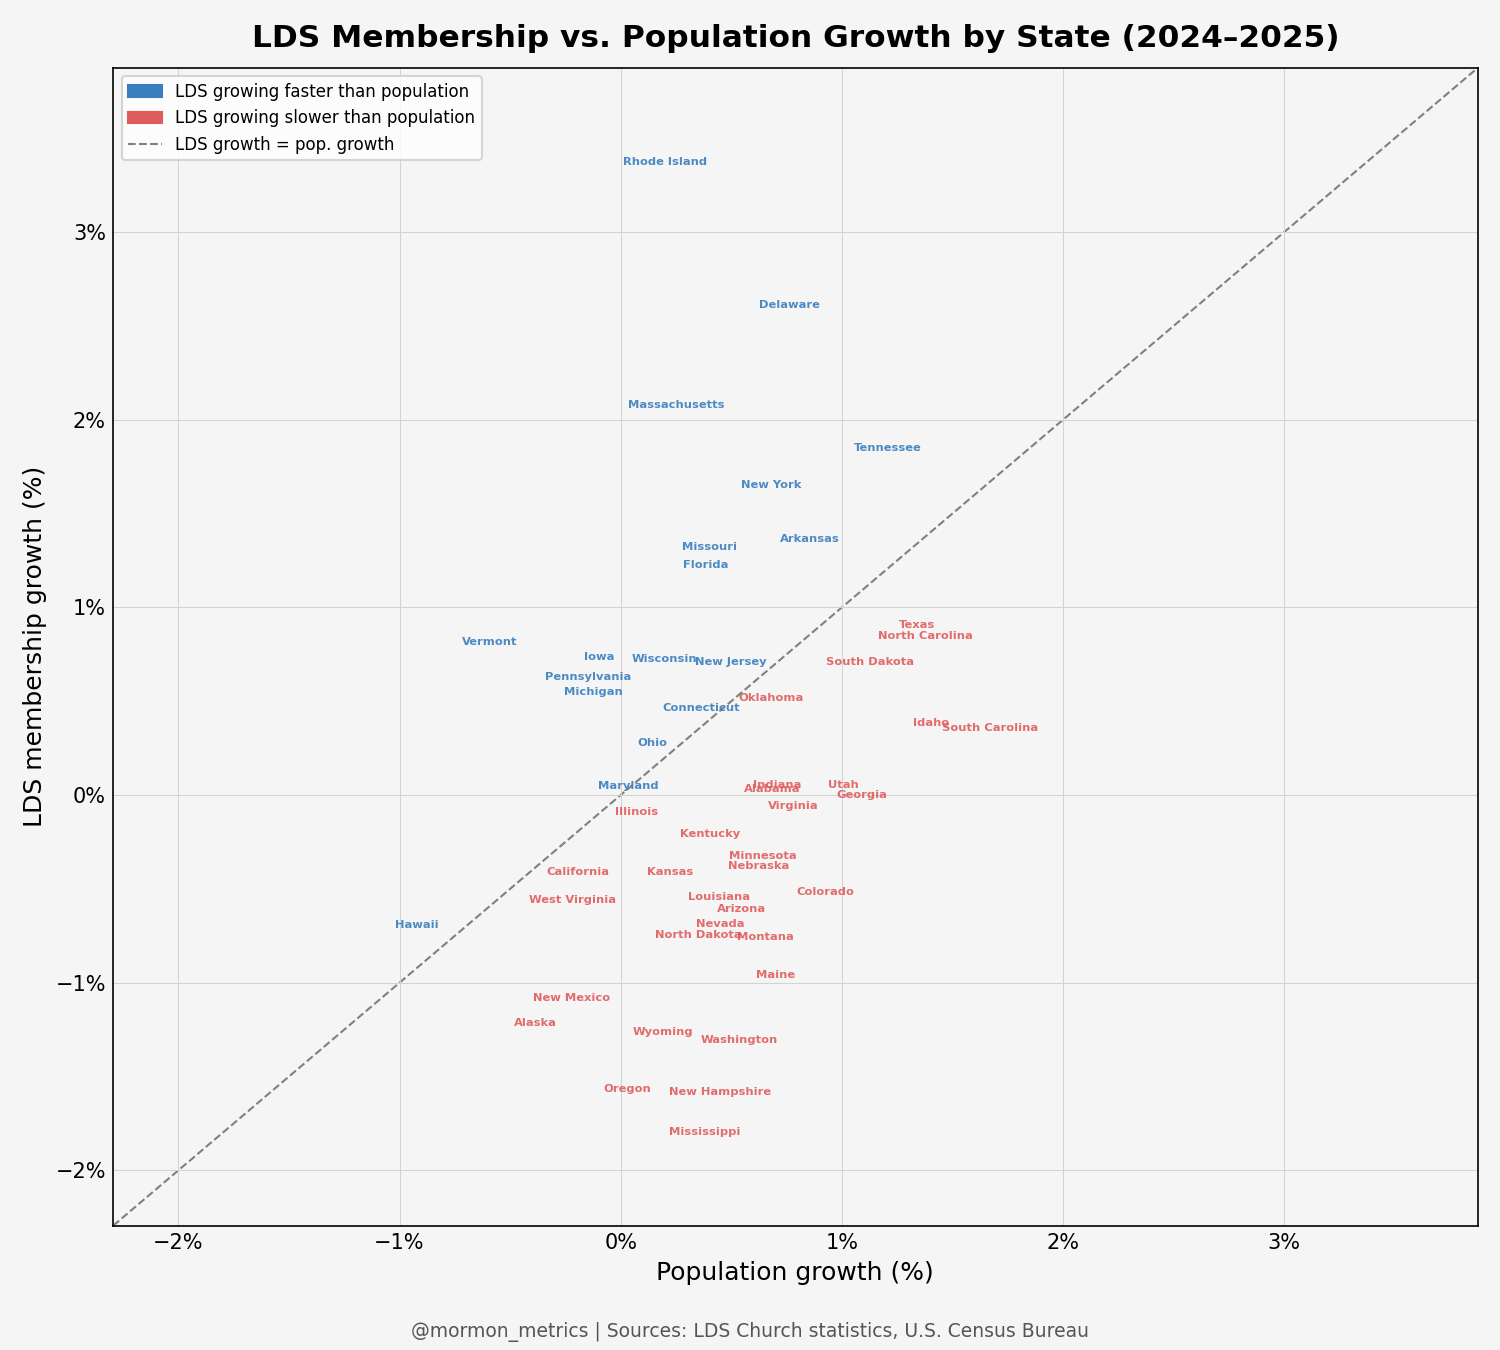
Plotting LDS growth against population growth from 2024 to 2025 shows the pattern directly. The diagonal is the breakeven line — points above it are states where the church gained share, points below are states where it lost ground.
The Northeast clusters above the line. Rhode Island, Delaware, Massachusetts, Vermont, and New York all show real outperformance — LDS membership growing in states with flat or declining populations. That’s genuine ground gained, not migration spillover.
The Mountain West and Pacific Northwest cluster below the line. Idaho, Utah, Nevada, Colorado, Washington, and Oregon all sit in negative-share territory. Some look fine in raw membership terms but lose ground once you adjust for state population growth.
And here’s the finding that most directly contradicts last week’s framing: most of the Bible Belt sits below or right on the diagonal. Texas, North Carolina, and South Carolina all lost share. The exceptions are narrower than I implied — Tennessee, Arkansas, Missouri — and concentrated in the inner South rather than the high-growth Sunbelt.
US regional: three of four regions are losing share
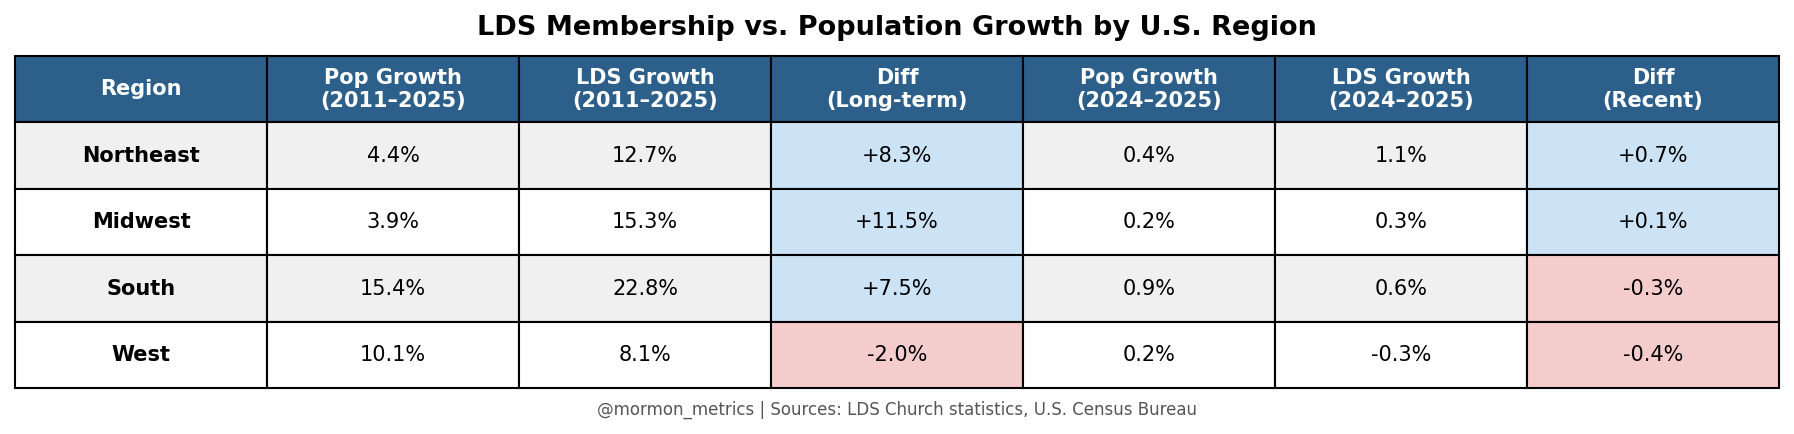
The regional aggregation is where the story really shifts. Last week I wrote that the West was driving the US decline while the other three regions grew. Under the share-relative metric:
Northeast is the only region clearly gaining ground (+0.7%)
Midwest is essentially flat (+0.1%)
South is now losing share (-0.3%) — this is a change from long-term, where it had been outperforming
West continues to lose share (-0.4%)
So the corrected regional headline is sharper than last week’s: the Northeast is the only US region meaningfully gaining ground, and three of four regions are now losing share against their populations. Last week’s “three of four regions growing” framing conflated raw membership change with the underlying demographic dynamics.
Long-term state-level: this isn't a one-year fluke
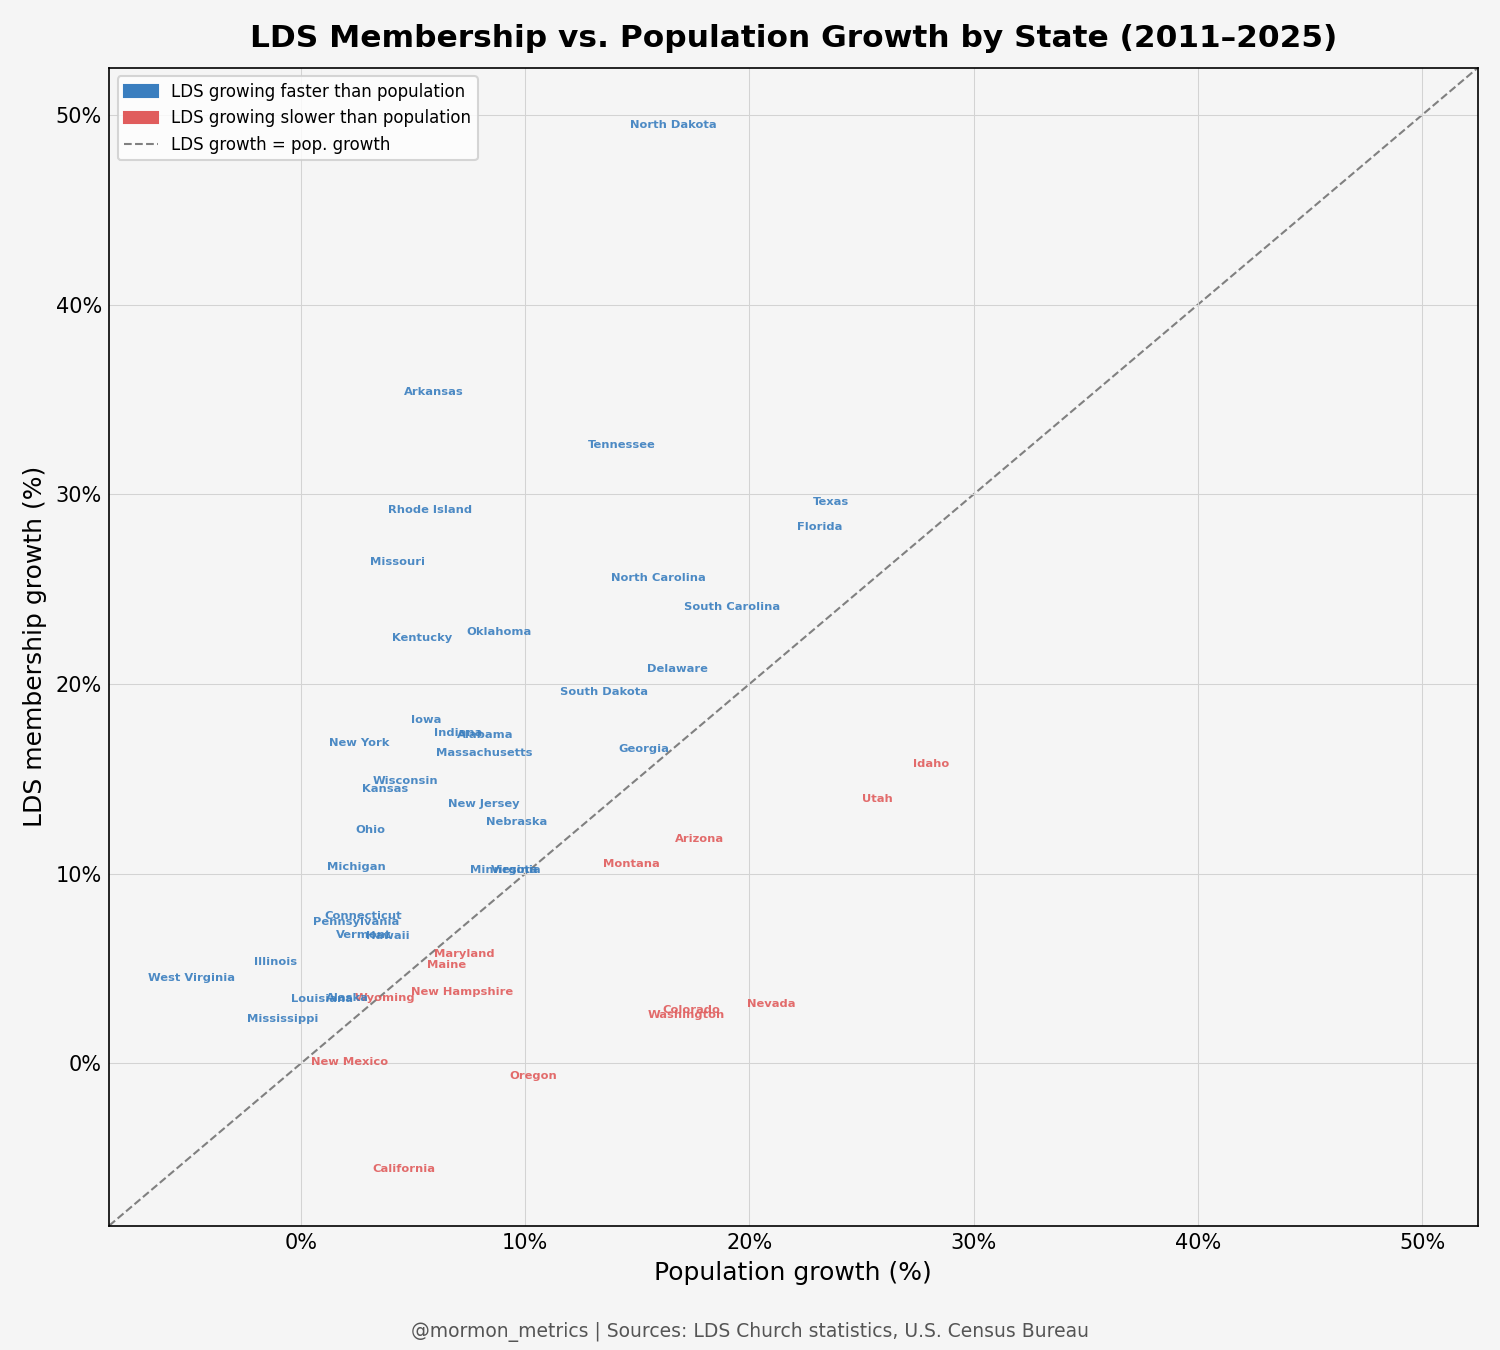
Zooming out to 2011-2025 confirms the patterns above are structural, not anomalies.
Idaho, Utah, Nevada, Colorado, and Washington sit dramatically below the diagonal. Their populations grew 17-28% over 14 years; their LDS counts grew 3-16%. Nevada is the most extreme case: 21% population growth, 3% LDS growth, a 17.8 percentage point share loss. The Mountain West has been quietly de-Mormonizing in proportional terms for over a decade — last week’s snapshot was just the latest data point in a long-running trend.
The long-term outperformers are a more interesting mix: North Dakota (likely Bakken-related), Arkansas, Rhode Island, Missouri, Tennessee, Kentucky. A few of these are small LDS bases where small absolute gains create large percentage moves, so weight the tiny states accordingly. But the broader pattern — Northeast and inner South gaining share, Mountain West and Pacific losing it — is consistent across both time horizons and across multiple states within each region.
Country-level: the US lags behind the globe
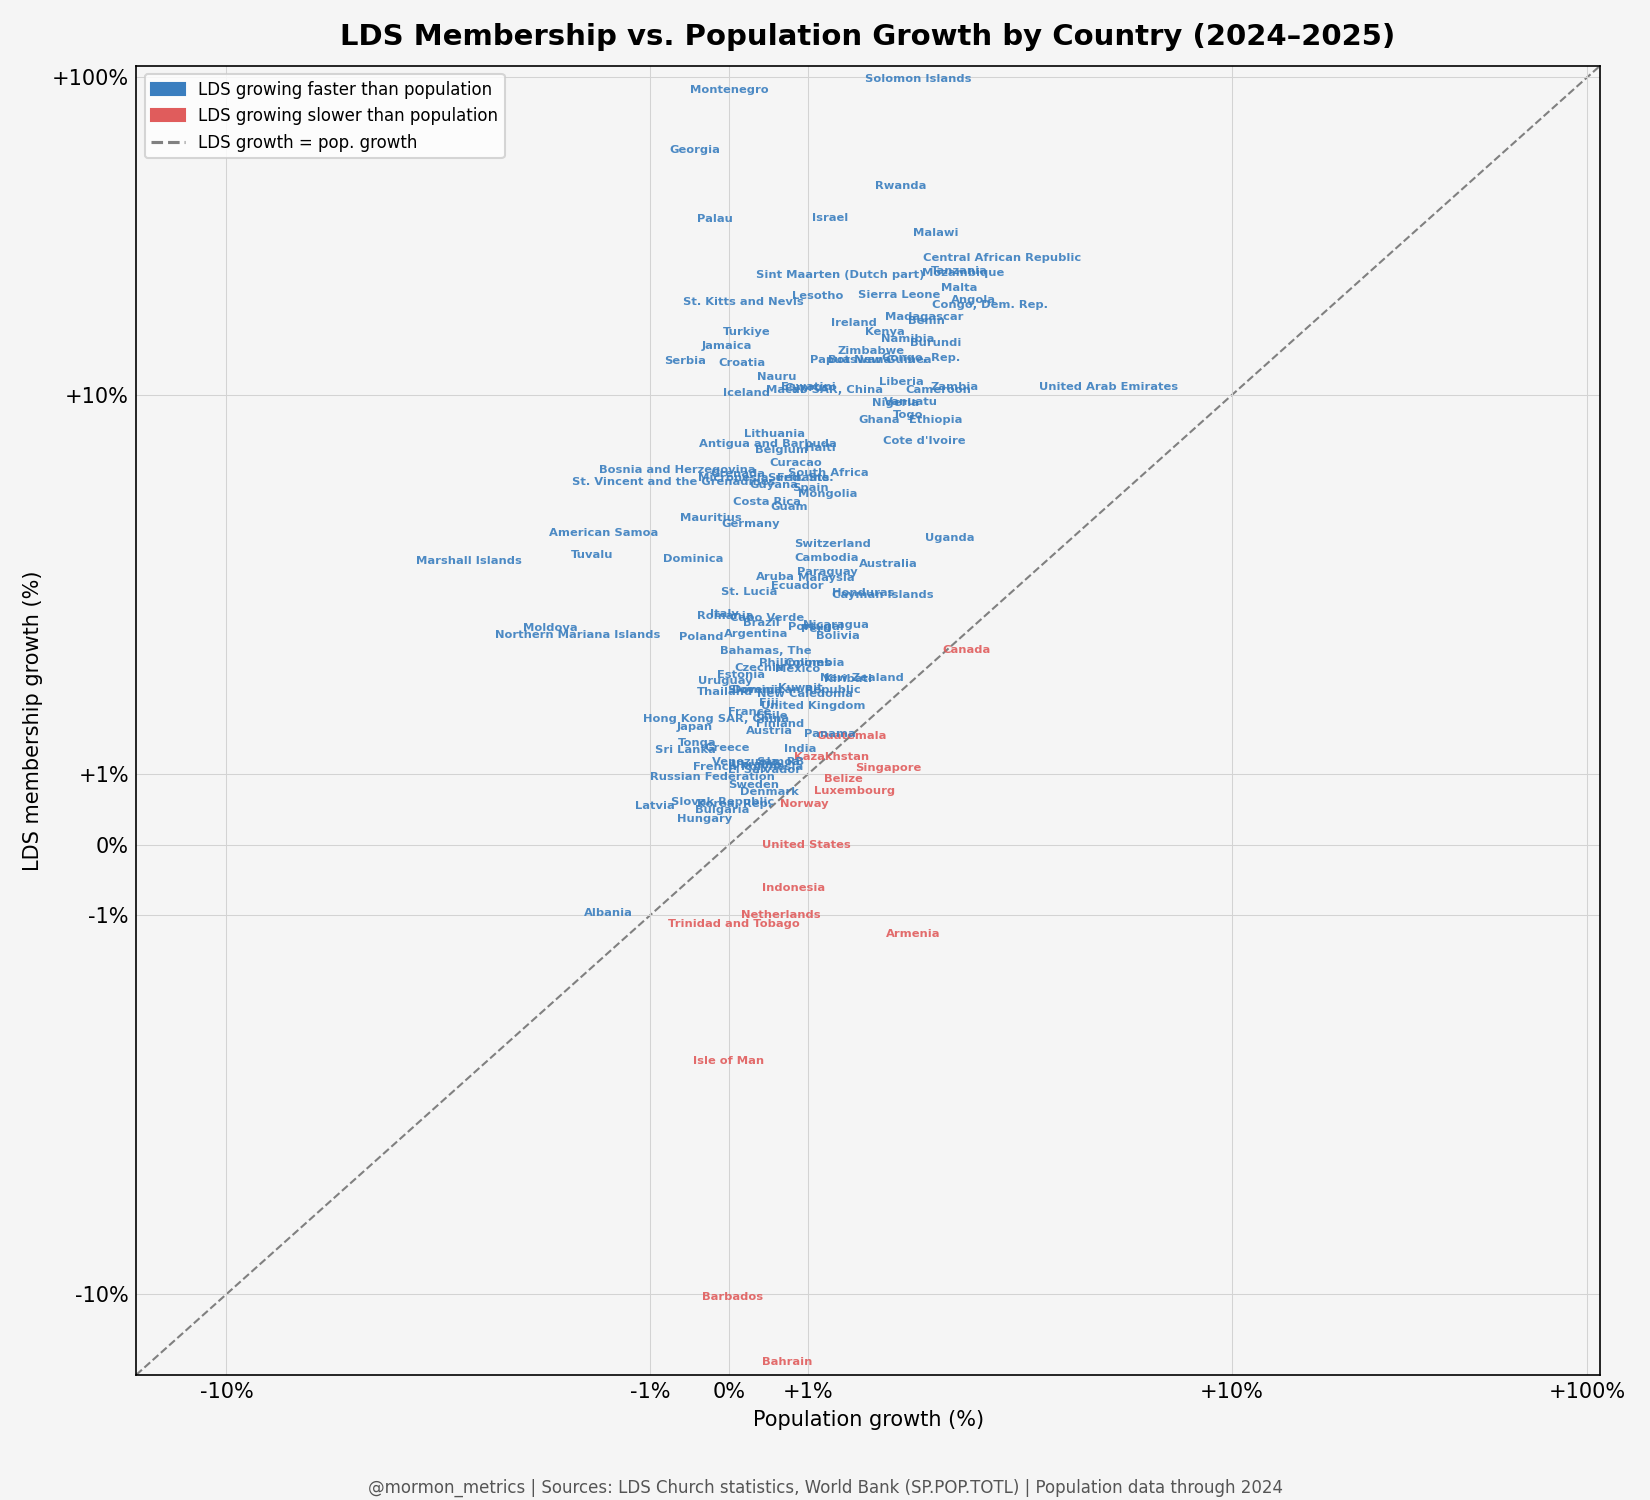
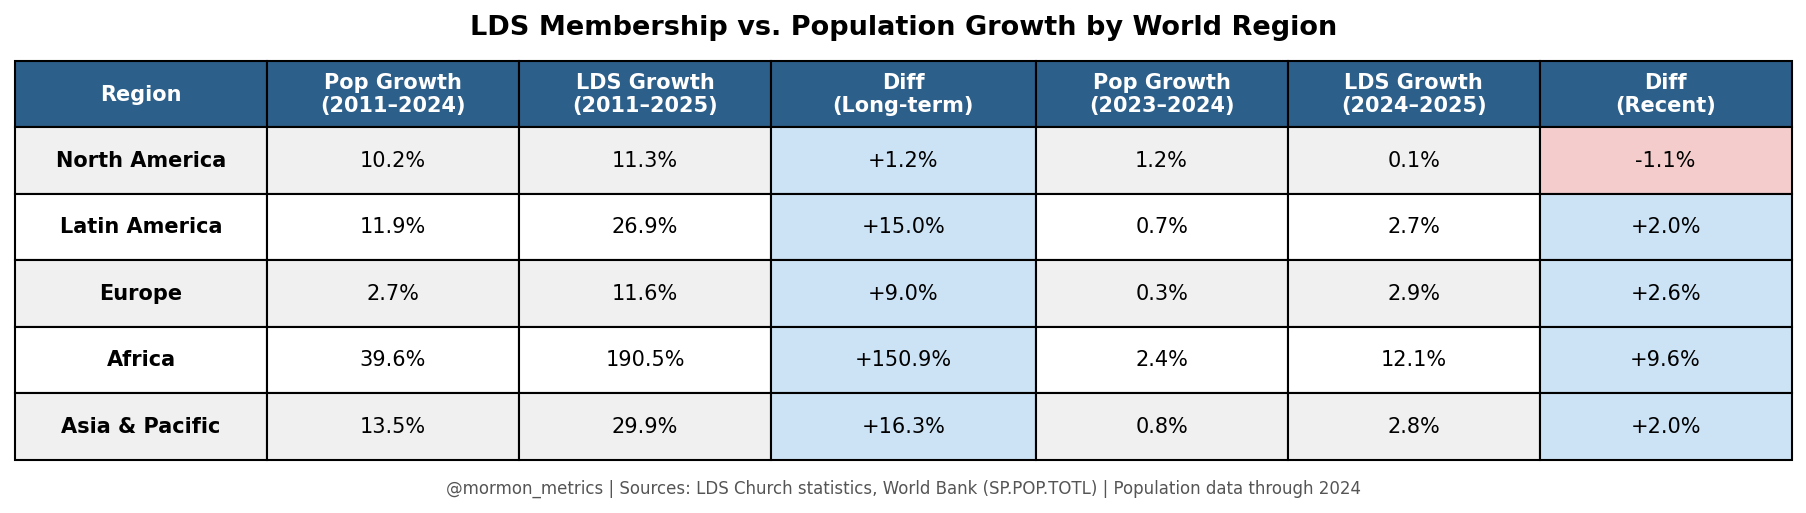
Pulling back to the global picture changes the interpretation again. Almost every country sits above the diagonal long-term — LDS growth has outpaced population growth essentially everywhere except a handful of high-income outliers. Africa dominates: regional LDS growth of 190% against population growth of 40%, a 150 percentage point share gain.
North America is lagging behind. Long-term share gain of just 1.2% — essentially flat. And in 2024-2025, North America showed share loss of 1.1%, the only region globally that lost ground.
The counterintuitive finding here: the US is doing worse than Europe in relative terms. Europe is usually framed as the church’s hardest market, but European populations are barely growing, so even modest LDS growth registers as outperformance. The US population is still growing fast enough that near-flat LDS membership reads as a contraction once you adjust.
Takeaways
A few things shift under the share-relative metric:
The Bible Belt growth story from last week was overstated. Most of the South’s recent LDS gains are actually just population growth, and the region just flipped to losing share in 2024-2025.
The Northeast is the bright spot — state-level (MA, RI, NY, DE, VT), regional (only US region clearly gaining ground), and consistent across both recent and long-term horizons. I don’t have a confident theory for why; my best guess involves small-base statistical noise combined with selective in-migration of LDS members to commuter cities like Boston, DC, and NYC, but I’d want to look more carefully before committing to it.
The Mountain West contraction is structural. Idaho, Utah, Nevada, and Colorado have been losing share for over a decade. The 2024-2025 numbers extend a long-running trend rather than mark a turning point.
In global context, the US is the underperformer. North America is the only world region that lost share in 2024-2025, and the only region where long-term LDS growth has barely outpaced population growth at all. The US is the most sizeable
The methodological point underneath all of this: be careful with raw growth numbers when underlying populations are moving fast. The right denominator depends on the question you’re asking, and “is the church gaining ground?” needs a population-adjusted denominator to get to the heart of the question.
Thanks again to Jason for the email (and for others who shared their thoughts) — posts like last week’s are better when readers actually engage with the data and push back. If you’re seeing things in the dashboard I haven’t covered, I want to hear about it.
You can explore the underlying numbers yourself in the dashboard.
Have theories on why the Northeast is outperforming — or skepticism about the metric? Drop them in the comments.
Great refinement!
I'm interested in how activity rates are changing as a proxy for how many people consider themselves Mormons as opposed to how many the church counts.
I don't know if you have unit information for each state / country historically, but that can be used to make rough estimates. For example, we could assume 250 active members per ward and 75 per branch, and compare that total to the official membership total.
Was excited to see what you'd do with the numbers and love that you looked at the global shifts too. Thanks for responding and even turning it into a full-blown assessment. Great stuff as always.